Range Filter Buy and Sell 5min## **Enhanced Range Filter Strategy: A Comprehensive Overview**
### **1. Introduction**
The **Enhanced Range Filter Strategy** is a powerful technical trading system designed to identify high-probability trading opportunities while filtering out market noise. It utilizes **range-based trend filtering**, **momentum confirmation**, and **volatility-based risk management** to generate precise entry and exit signals. This strategy is particularly useful for traders who aim to capitalize on trend-following setups while avoiding choppy, ranging market conditions.
---
### **2. Key Components of the Strategy**
#### **A. Range Filter (Trend Determination)**
- The **Range Filter** smooths price fluctuations and helps identify clear trends.
- It calculates an **adjusted price range** based on a **sampling period** and a **multiplier**, ensuring a dynamic trend-following approach.
- **Uptrends:** When the current price is above the range filter and the trend is strengthening.
- **Downtrends:** When the price falls below the range filter and momentum confirms the move.
#### **B. RSI (Relative Strength Index) as Momentum Confirmation**
- RSI is used to **filter out weak trades** and prevent entries during overbought/oversold conditions.
- **Buy Signals:** RSI is above a certain threshold (e.g., 50) in an uptrend.
- **Sell Signals:** RSI is below a certain threshold (e.g., 50) in a downtrend.
#### **C. ADX (Average Directional Index) for Trend Strength Confirmation**
- ADX ensures that trades are only taken when the trend has **sufficient strength**.
- Avoids trading in low-volatility, ranging markets.
- **Threshold (e.g., 25):** Only trade when ADX is above this value, indicating a strong trend.
#### **D. ATR (Average True Range) for Risk Management**
- **Stop Loss (SL):** Placed **one ATR below** (for long trades) or **one ATR above** (for short trades).
- **Take Profit (TP):** Set at a **3:1 reward-to-risk ratio**, using ATR to determine realistic price targets.
- Ensures volatility-adjusted risk management.
---
### **3. Entry and Exit Conditions**
#### **📈 Buy (Long) Entry Conditions:**
1. **Price is above the Range Filter** → Indicates an uptrend.
2. **Upward trend strength is positive** (confirmed via trend counter).
3. **RSI is above the buy threshold** (e.g., 50, to confirm momentum).
4. **ADX confirms trend strength** (e.g., above 25).
5. **Volatility is supportive** (using ATR analysis).
#### **📉 Sell (Short) Entry Conditions:**
1. **Price is below the Range Filter** → Indicates a downtrend.
2. **Downward trend strength is positive** (confirmed via trend counter).
3. **RSI is below the sell threshold** (e.g., 50, to confirm momentum).
4. **ADX confirms trend strength** (e.g., above 25).
5. **Volatility is supportive** (using ATR analysis).
#### **🚪 Exit Conditions:**
- **Stop Loss (SL):**
- **Long Trades:** 1 ATR below entry price.
- **Short Trades:** 1 ATR above entry price.
- **Take Profit (TP):**
- Set at **3x the risk distance** to achieve a favorable risk-reward ratio.
- **Ranging Market Exit:**
- If ADX falls below the threshold, indicating a weakening trend.
---
### **4. Visualization & Alerts**
- **Colored range filter line** changes based on trend direction.
- **Buy and Sell signals** appear as labels on the chart.
- **Stop Loss and Take Profit levels** are plotted as dashed lines.
- **Gray background highlights ranging markets** where trading is avoided.
- **Alerts trigger on Buy, Sell, and Ranging Market conditions** for automation.
---
### **5. Advantages of the Enhanced Range Filter Strategy**
✅ **Trend-Following with Noise Reduction** → Helps avoid false signals by filtering out weak trends.
✅ **Momentum Confirmation with RSI & ADX** → Ensures that only strong, valid trades are executed.
✅ **Volatility-Based Risk Management** → ATR ensures adaptive stop loss and take profit placements.
✅ **Works on Multiple Timeframes** → Effective for day trading, swing trading, and scalping.
✅ **Visually Intuitive** → Clearly displays trade signals, SL/TP levels, and trend conditions.
---
### **6. Who Should Use This Strategy?**
✔ **Trend Traders** who want to enter trades with momentum confirmation.
✔ **Swing Traders** looking for medium-term opportunities with a solid risk-reward ratio.
✔ **Scalpers** who need precise entries and exits to minimize false signals.
✔ **Algorithmic Traders** using alerts for automated execution.
---
### **7. Conclusion**
The **Enhanced Range Filter Strategy** is a powerful trading tool that combines **trend-following techniques, momentum indicators, and risk management** into a structured, rule-based system. By leveraging **Range Filters, RSI, ADX, and ATR**, traders can improve trade accuracy, manage risk effectively, and filter out unfavorable market conditions.
This strategy is **ideal for traders looking for a systematic, disciplined approach** to capturing trends while **avoiding market noise and false breakouts**. 🚀
Cari dalam skrip untuk "relative strength"

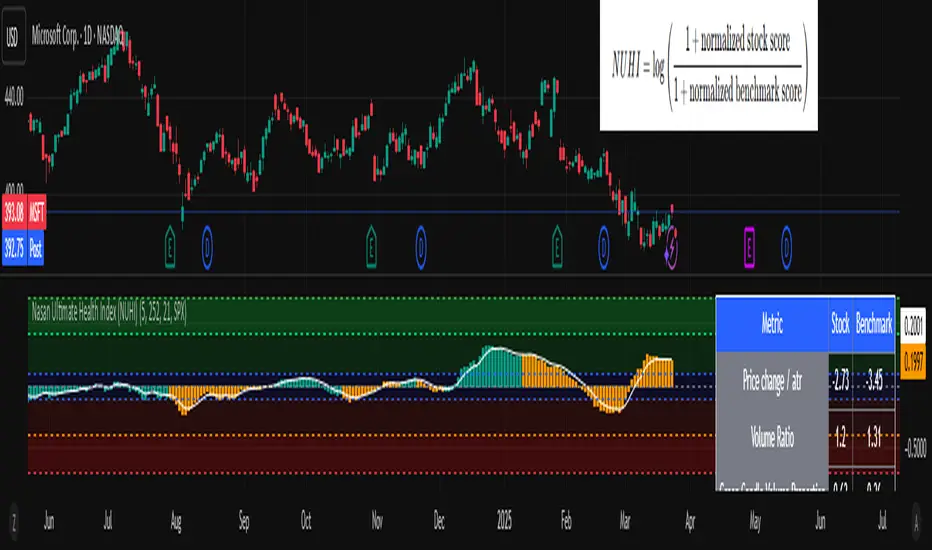
Nasan Ultimate Health Index (NUHI)The Nasan Ultimate Health Index (NUHI) is a technical indicator designed to measure the relative health of a stock compared to a benchmark index or sector. By incorporating price action, volume dynamics, and volatility, NUHI provides traders with a clearer picture of a stock’s performance relative to the broader market.
The NUHI is based on the idea that a stock’s relative strength and momentum can be assessed more effectively when adjusted for volume behavior and benchmark comparison. Instead of looking at price movement alone, this indicator factors in:
The stock’s price trend (via EMA)
Volume participation (green vs. red volume) and volume ratio - SMA(volume, 21)/ SMA(volume, 252)
Volatility-adjusted performance (ATR-based scaling)
Comparison with a selected benchmark (e.g., SPX, NDX, sector ETFs)
This results in a normalized and comparative score that helps traders identify outperforming, neutral, and underperforming stocks within a specific market environment.
The NUHI is constructed using the following elements:
1️⃣ Stock Raw Score (Unadjusted Momentum)
The exponential moving average (EMA) of the hlc3 (average of high, low, close) is used to define the price trend.
The difference between the current EMA and the EMA from n bars ago shows whether the stock is gaining or losing momentum.
This difference is divided by the ATR (Average True Range) to adjust for volatility.
2️⃣ Volume Behavior Adjustment
Volume is split into green volume (up candles) and red volume (down candles).
The ratio of green to red volume determines whether buyers or sellers dominate over the selected period (n bars).
If the stock is in an uptrend, green volume is weighted higher; if in a downtrend, red volume is weighted higher.
The stock’s Volume Ratio (short-term SMA divided by long-term SMA) is adjusted based on this weight.
3️⃣ Benchmark Comparison
A similar Raw Score calculation is performed on the selected benchmark (SPX, NDX, or sector ETF).
Benchmark price movements, volume behavior, and ATR adjustments mirror the stock’s calculations.
This provides a reference point for evaluating the stock’s relative strength.
4️⃣ Normalization Process
Both the stock and benchmark raw scores are min-max normalized over the past 252 bars (1-year lookback).
This scales values between 0 and 1, ensuring fair comparisons regardless of absolute price differences.
5️⃣ NUHI Calculation
The final NUHI value is computed using a logarithmic ratio between the normalized stock score and the normalized benchmark score:
This transformation ensures a more symmetrical representation of overperformance and underperformance.
Performance Zones
Strong Outperforming (NUHI between >0.41 and 0.69)
Leading (NUHI between >0.10 and 0.41)
Transitioning Outperformance (NUHI between 0.10 and 0)
Equilibrium (NUHI 0)
Transitioning Underperformance (NUHI between -0.10 and 0)
Lagging (NUHI between < -0.1 and -0.41)
Strong Underperforming (NUHI between< -0.41 and -0.69 )
How to Use NUHI
✅ Identifying Strong Stocks
If NUHI > 0, the stock is outperforming its benchmark.
If NUHI < 0, the stock is underperforming the benchmark.
✅ Trend Confirmation
A steadily rising NUHI and raw score (colored green) suggests sustained strength bullish conditions.
A falling NUHI and raw score (colored orange) indicates weakness and possible rotation into other assets.
✅ Finding Reversals
Bullish Divergence: If NUHI is improving while the stock’s raw score is negative, it may signal a bottoming opportunity.
Bearish Signs: If NUHI is dropping despite price strength, it could hint at underlying weakness.
Why a Stock in a Downtrend Can Have NUHI > 0 (and Vice Versa )
NUHI measures performance relative to both its own history and the benchmark.
A stock’s recent movement is compared to how it usually behaves and how the benchmark is performing.
Example Scenarios:
Stock in a Downtrend but NUHI > 0
The stock may still be in a downtrend (negative raw score), but it’s performing better relative to its past downtrend behavior and better than the benchmark over the same period.
This could mean it’s showing relative strength compared to the broader market or sector.
Stock in an Uptrend but NUHI < 0
Even in a uptrend (positive raw score), the stock might be underperforming relative to its past uptrend behavior and underperforming the benchmark.
What This Means:
NUHI > 0 in a downtrend → The stock is falling less aggressively than usual and/or holding up better than the benchmark.
NUHI < 0 in an uptrend → The stock is gaining less than expected based on its history and/or lagging behind the benchmark.
NUHI helps identify relative strength or weakness .
Rosiz Support 2### **Indicator Name**: Custom RSI, Stochastic, and ADX
### **Description**:
This is a multi-functional indicator that combines three popular technical analysis tools—**RSI (Relative Strength Index)**, **Stochastic Oscillator**, and **ADX (Average Directional Index)**—into a single, customizable pane. This indicator helps traders analyze momentum, overbought/oversold conditions, and trend strength simultaneously, making it a powerful tool for making informed trading decisions.
---
### **Features**:
1. **RSI (Relative Strength Index)**:
- Measures the speed and change of price movements.
- Helps identify overbought (>70) and oversold (<30) conditions.
- Includes customizable length and source options.
- Background shading visually highlights overbought and oversold zones.
2. **Stochastic Oscillator**:
- Determines momentum by comparing a security's closing price to its price range over a specific period.
- Includes %K and %D lines for crossovers, which signal potential entry or exit points.
- Highlights overbought (>80) and oversold (<20) zones with background fill.
3. **ADX (Average Directional Index)**:
- Measures trend strength (higher values indicate stronger trends).
- Includes customizable smoothing and DI (Directional Indicator) length.
---
### **How to Use**:
- **RSI**: Look for overbought or oversold conditions for potential reversal points. Divergences between price and RSI may signal weakening trends.
- **Stochastic Oscillator**: Watch for %K and %D crossovers near overbought or oversold zones to confirm buy or sell signals.
- **ADX**: Use ADX values to assess trend strength:
- **ADX > 25**: Strong trend.
- **ADX < 20**: Weak or ranging market.
---
### **Customization Options**:
- **RSI Settings**: Adjust length, source, and visual parameters.
- **Stochastic Settings**: Modify %K and %D lengths and smoothing factors.
- **ADX Settings**: Fine-tune smoothing and directional index lengths.
---
### **Advantages**:
- Combines three indicators into one, reducing chart clutter.
- Customizable inputs for flexibility in various trading strategies.
- Visual enhancements (background fills and lines) for better readability.
This indicator is perfect for traders looking to combine momentum analysis, overbought/oversold signals, and trend strength in a single tool!

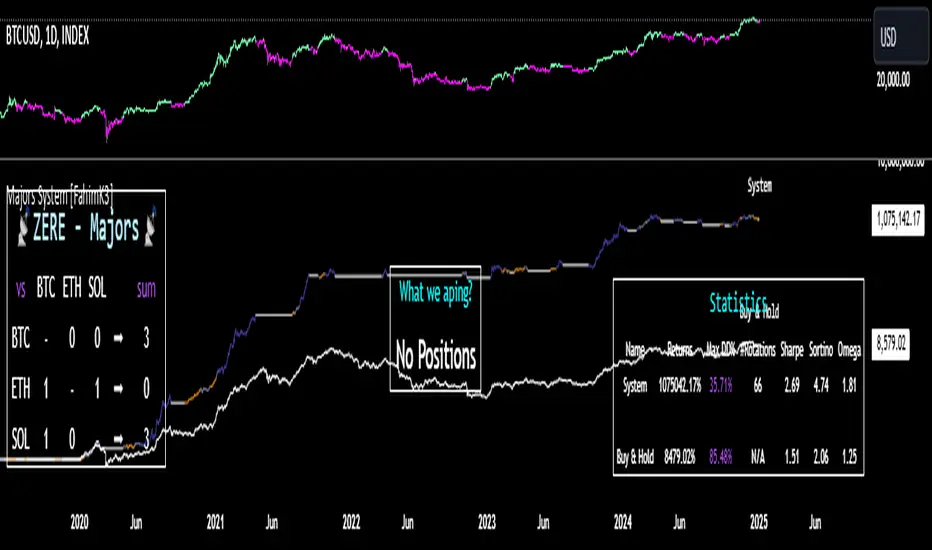
ZERE Majors System [FahimK3]ZERE Majors System
This system introduces an innovative approach to crypto portfolio management through a dynamic matrix-based rotation methodology. At its core, the system utilizes a proprietary scoring matrix that directly compares the relative strength between BTC, ETH, and SOL, creating a more nuanced understanding of asset relationships than traditional indicators alone could provide.
The fundamental innovation lies in how the system evaluates cryptocurrencies. Rather than analyzing each asset independently, it employs a comprehensive matrix where each asset is scored against others through direct pair-wise comparisons. This creates a network of relationships that reveals underlying strength patterns that might be missed by conventional analysis methods. The scoring process incorporates both momentum and relative performance metrics, ensuring that capital is allocated to the truly strongest asset rather than just the one showing temporary strength.
While the exact scoring calculations remain proprietary, the system's framework combines relative strength principles with adaptive thresholds that automatically adjust to changing market conditions. This differs from standard relative strength approaches by considering the complete web of relationships between assets rather than isolated comparisons.
The regime filter serves as a secondary confirmation layer, using volatility and momentum metrics to validate the primary matrix signals. When market conditions become unfavorable, the system automatically moves to cash, providing an additional layer of capital protection.
Performance tracking includes comprehensive metrics comparing the rotation strategy against a standard buy-and-hold approach. The visual interface displays the scoring matrix, current positions, and equity curves, allowing traders to understand position rationale in real-time.
Recommended Usage:
- Timeframe: Daily chart
- Starting Capital: Customizable for portfolio size
- Scoring Method: Choice between UNI.v2 and UNI.v3
Note: While this system incorporates some standard technical elements, its value lies in the unique matrix-based rotation methodology that provides a more complete picture of relative strength than traditional indicators used in isolation.
RS Cycles [QuantVue]The RS Cycles indicator is a technical analysis tool that expands upon traditional relative strength (RS) by incorporating Beta-based adjustments to provide deeper insights into a stock's performance relative to a benchmark index. It identifies and visualizes positive and negative performance cycles, helping traders analyze trends and make informed decisions.
Key Concepts:
Traditional Relative Strength (RS):
Definition: A popular method to compare the performance of a stock against a benchmark index (e.g., S&P 500).
Calculation: The traditional RS line is derived as the ratio of the stock's closing price to the benchmark's closing price.
RS=Stock Price/Benchmark Price
Usage: This straightforward comparison helps traders spot periods of outperformance or underperformance relative to the market or a specific sector.
Beta-Adjusted Relative Strength (Beta RS):
Concept: Traditional RS assumes equal volatility between the stock and benchmark, but Beta RS accounts for the stock's sensitivity to market movements.
Calculation:
Beta measures the stock's return relative to the benchmark's return, adjusted by their respective volatilities.
Alpha is then computed to reflect the stock's performance above or below what Beta predicts:
Alpha=Stock Return−(Benchmark Return×β)
Significance: Beta RS highlights whether a stock outperforms the benchmark beyond what its Beta would suggest, providing a more nuanced view of relative strength.
RS Cycles:
The indicator identifies positive cycles when conditions suggest sustained outperformance:
Short-term EMA (3) > Mid-term EMA (10) > Long-term EMA (50).
The EMAs are rising, indicating positive momentum.
RS line shows upward movement over a 3-period window.
EMA(21) > 0 confirms a broader uptrend.
Negative cycles are marked when the opposite conditions are met:
Short-term EMA (3) < Mid-term EMA (10) < Long-term EMA (50).
The EMAs are falling, indicating negative momentum.
RS line shows downward movement over a 3-period window.
EMA(21) < 0 confirms a broader downtrend.
This indicator combines the simplicity of traditional RS with the analytical depth of Beta RS, making highlighting true relative strength and weakness cycles.

Currency StrengthThis innovative Currency Strength Indicator is a powerful tool for forex traders, offering a comprehensive and visually intuitive way to analyze the relative strength of multiple currencies simultaneously. Here's what makes this indicator stand out:
Extensive Currency Coverage
One of the most striking features of this indicator is its extensive coverage of currencies. While many similar tools focus on just the major currencies, this indicator includes:
Major currencies: USD, EUR, JPY, GBP, CHF, CAD, AUD, NZD
Additional currencies: CNY, HKD, KRW, MXN, INR, RUB, SGD, TRY, BRL, ZAR, THB
This wide range allows traders to gain insights into a broader spectrum of the forex market, including emerging markets and less commonly traded currencies.
Unique Visual Presentation
The indicator boasts a clear and user-friendly interface:
Each currency is represented by a distinct colored line for easy identification
A legend is prominently displayed at the top of the chart, using color-coded labels for quick reference
Users can customize which currencies to display, allowing for a tailored analysis
This clean, organized presentation enables traders to quickly grasp the relative strengths of different currencies at a glance.
Robust Measurement Methodology
The indicator employs the True Strength Index (TSI) to calculate currency strength, which provides several advantages:
TSI is a momentum oscillator that shows both trend direction and overbought/oversold conditions
It uses two smoothing periods (fast and slow), which helps filter out market noise and provides more reliable signals
The indicator calculates TSI for each currency index (e.g., DXY for USD, EXY for EUR), ensuring a comprehensive strength measurement
By using TSI, this indicator offers a more nuanced and accurate representation of currency strength compared to simpler moving average-based indicators.
Customization and Flexibility
Traders can fine-tune the indicator to suit their needs:
Adjustable TSI parameters (fast and slow periods)
Ability to show/hide specific currencies
Customizable color scheme for each currency line
Practical Applications
This Currency Strength Indicator can be used for various trading strategies:
Identifying potential trend reversals when a currency reaches extreme overbought or oversold levels
Spotting divergences between currency pairs
Confirming trends across multiple timeframes
Enhancing multi-pair trading strategies
By providing a clear, comprehensive, and customizable view of currency strength across a wide range of currencies, this indicator equips traders with valuable insights for making informed trading decisions in the complex world of forex.

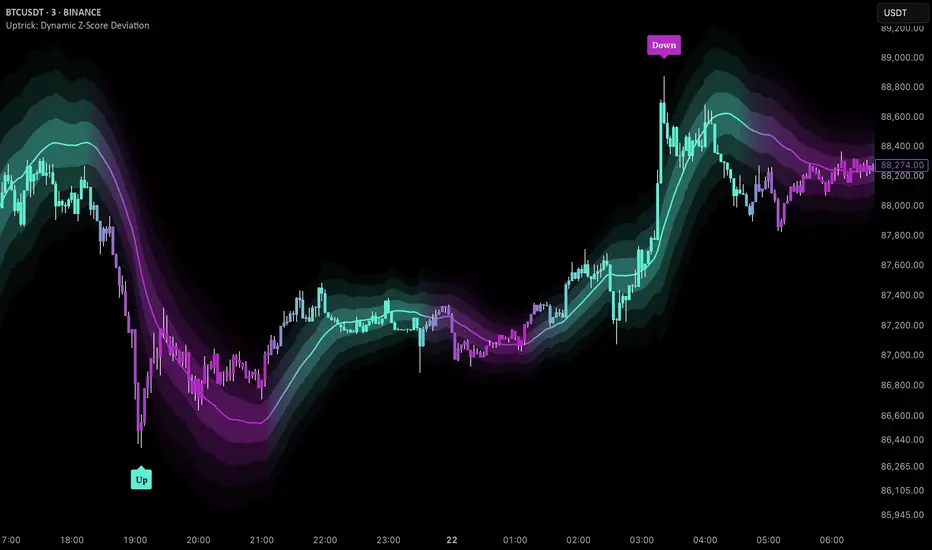
Uptrick: MultiTrend Squeeze System**Uptrick: MultiTrend Squeeze System Indicator: The Ultimate Trading Tool for Precision and Versatility 📈🔥**
### Introduction
The MultiTrend Squeeze System is a powerful, multi-faceted trading indicator designed to provide traders with precise buy and sell signals by combining the strengths of multiple technical analysis tools. This script isn't just an indicator; it's a comprehensive trading system that merges the power of SuperTrend, RSI, Volume Filtering, and Squeeze Momentum to give you an unparalleled edge in the market. Whether you're a day trader looking for short-term opportunities or a swing trader aiming to catch longer-term trends, this indicator is tailored to meet your needs.
### Key Features and Unique Aspects
1. **SuperTrend with Dynamic Adjustments 📊**
- **Adaptive SuperTrend Calculation:** The SuperTrend is a popular trend-following indicator that adjusts dynamically based on market conditions. It uses the Average True Range (ATR) to calculate upper and lower bands, which shift according to market volatility. This script takes it further by combining it with the RSI and Volume filtering to provide more accurate signals.
- **Direction Sensitivity:** The SuperTrend here is not static. It adjusts based on the direction of the previous SuperTrend value, ensuring that the indicator remains relevant even in choppy markets.
2. **RSI Integration for Overbought/Oversold Conditions 💹**
- **RSI Calculation:** The Relative Strength Index (RSI) is incorporated to identify overbought and oversold conditions, adding an extra layer of precision. This helps in filtering out false signals and ensuring that trades are taken only in optimal conditions.
- **Customizable RSI Settings:** The RSI settings are fully customizable, allowing traders to adjust the RSI length and the overbought/oversold levels according to their trading style and market.
3. **Volume Filtering for Enhanced Signal Confirmation 📉**
- **Volume Multiplier:** This unique feature integrates volume analysis, ensuring that signals are only generated when there is sufficient market participation. The Volume Multiplier can be adjusted to filter out weak signals that occur during low-volume periods.
- **Optional Volume Filtering:** Traders have the flexibility to turn the volume filter on or off, depending on their preference or market conditions. This makes the indicator versatile, allowing it to be used across different asset classes and market conditions.
4. **Squeeze Momentum Indicator (SMI) for Market Pressure Analysis 💥**
- **Squeeze Detection:** The Squeeze Momentum Indicator detects periods of market compression and expansion. This script goes beyond the traditional Bollinger Bands and Keltner Channels by incorporating true range calculations, offering a more nuanced view of market momentum.
- **Customizable Squeeze Settings:** The lengths and multipliers for both Bollinger Bands and Keltner Channels are customizable, giving traders the flexibility to fine-tune the indicator based on their specific needs.
5. **Visual and Aesthetic Customization 🎨**
- **Color-Coding for Clarity:** The indicator is color-coded to make it easy to interpret signals. Bullish trends are marked with a vibrant green color, while bearish trends are highlighted in red. Neutral or unconfirmed signals are displayed in softer tones to reduce noise.
- **Histogram Visualization:** The primary trend direction and strength are displayed as a histogram, making it easy to visualize the market's momentum at a glance. The height and color of the bars provide immediate feedback on the strength and direction of the trend.
6. **Alerts for Real-Time Trading 🚨**
- **Custom Alerts:** The script is equipped with custom alerts that notify traders when a buy or sell signal is generated. These alerts can be configured to send notifications through various channels, including email, SMS, or directly to the trading platform.
- **Immediate Reaction:** The alerts are triggered based on the confluence of SuperTrend, RSI, and Volume signals, ensuring that traders are notified only when the most robust trading opportunities arise.
7. **Comprehensive Input Customization ⚙️**
- **SuperTrend Settings:** Adjust the ATR length and factor to control the sensitivity of the SuperTrend. This allows you to adapt the indicator to different market conditions, whether you're trading a volatile cryptocurrency or a more stable stock.
- **RSI Settings:** Customize the RSI length and thresholds for overbought and oversold conditions, enabling you to tailor the indicator to your specific trading strategy.
- **Volume Settings:** The Volume Multiplier and the option to toggle the volume filter provide an additional layer of customization, allowing you to fine-tune the indicator based on market liquidity and participation.
- **Squeeze Momentum Settings:** The lengths and multipliers for Bollinger Bands and Keltner Channels can be adjusted to detect different levels of market compression, providing flexibility for both short-term and long-term traders.
### How It Works: A Deep Dive Into the Mechanics 🛠️
1. **SuperTrend Calculation:**
- The SuperTrend is calculated using the ATR, which measures market volatility. The indicator creates upper and lower bands around the price, adjusting these bands based on the current level of market volatility. The direction of the trend is determined by the position of the price relative to these bands.
- The script enhances the standard SuperTrend by ensuring that the bands do not flip-flop too quickly, reducing the chances of false signals in a choppy market. The direction is confirmed by checking the position of the close relative to the previous band, making the trend detection more reliable.
2. **RSI Integration:**
- The RSI is calculated over a customizable length and compared to user-defined overbought and oversold levels. When the RSI crosses below the oversold level, and the SuperTrend indicates a bullish trend, a buy signal is generated. Conversely, when the RSI crosses above the overbought level, and the SuperTrend indicates a bearish trend, a sell signal is triggered.
- The combination of RSI with SuperTrend ensures that trades are only taken when there is a strong confluence of signals, reducing the chances of entering trades during weak or indecisive market phases.
3. **Volume Filtering:**
- The script calculates the average volume over a 20-period simple moving average. The volume filter ensures that buy and sell signals are only valid when the current volume exceeds a multiple of this average, which can be adjusted by the user. This feature helps filter out weak signals that might occur during low-volume periods, such as just before a major news event or during after-hours trading.
- The volume filter is particularly useful in markets where volume spikes are common, as it ensures that signals are only generated when there is significant market interest in the direction of the trend.
4. **Squeeze Momentum:**
- The Squeeze Momentum Indicator (SMI) adds a layer of market pressure analysis. The script calculates Bollinger Bands and Keltner Channels, detecting when the market is in a "squeeze" — a period of low volatility that typically precedes a significant price move.
- When the Bollinger Bands are inside the Keltner Channels, the market is in a squeeze (compression phase). This is often a precursor to a breakout or breakdown. The script colors the histogram bars black during this phase, indicating a potential for a strong move. Once the squeeze is released, the bars are colored according to the direction of the SuperTrend, signaling a potential entry point.
5. **Integration and Signal Generation:**
- The script brings together the SuperTrend, RSI, Volume, and Squeeze Momentum to generate highly accurate buy and sell signals. A buy signal is triggered when the SuperTrend is bullish, the RSI indicates oversold conditions, and the volume filter confirms strong market participation. Similarly, a sell signal is generated when the SuperTrend is bearish, the RSI indicates overbought conditions, and the volume filter is met.
- The combination of these elements ensures that the signals are robust, reducing the likelihood of entering trades during weak or indecisive market conditions.
### Practical Applications: How to Use the MultiTrend Squeeze System 📅
1. **Day Trading:**
- For day traders, this indicator provides quick and reliable signals that can be used to enter and exit trades multiple times within a day. The volume filter ensures that you are trading during the most liquid times of the day, increasing the chances of successful trades. The Squeeze Momentum aspect helps you catch breakouts or breakdowns, which are common in intraday trading.
2. **Swing Trading:**
- Swing traders can use the MultiTrend Squeeze System to identify longer-term trends. By adjusting the ATR length and factor, you can make the SuperTrend more sensitive to catch longer-term moves. The RSI and Squeeze Momentum aspects help you time your entries and exits, ensuring that you get in early on a trend and exit before it reverses.
3. **Scalping:**
- For scalpers, the quick signals provided by this system, especially in combination with the volume filter, make it easier to take small profits repeatedly. The histogram bars give you a clear visual cue of the market's momentum, making it easier to scalp effectively.
4. **Position Trading:**
- Even position traders can benefit from this indicator by using it to confirm long-term trends. By adjusting the settings to less sensitive parameters, you can ensure that you are only entering trades when a strong trend is confirmed. The Squeeze Momentum indicator will help you stay in the trade during periods of consolidation, waiting for the next big move.
### Conclusion: Why the MultiTrend Squeeze System is a Game-Changer 🚀
The MultiTrend Squeeze System is not just another trading indicator; it’s a comprehensive trading strategy encapsulated within a single script. By combining the power
of SuperTrend, RSI, Volume Filtering, and Squeeze Momentum, this indicator provides a robust and versatile tool that can be adapted to various trading styles and market conditions.
**Why is it Unique?**
- **Multi-Dimensional Analysis:** Unlike many other indicators that rely on a single data point or calculation, this script incorporates multiple layers of analysis, ensuring that signals are based on a confluence of factors, which increases their reliability.
- **Customizability:** The vast range of input settings allows traders to tailor the indicator to their specific needs, whether they are trading forex, stocks, cryptocurrencies, or commodities.
- **Visual Clarity:** The color-coded bars, labels, and signals make it easy to interpret the market conditions at a glance, reducing the time needed to make trading decisions.
Whether you are a novice trader or an experienced market participant, the MultiTrend Squeeze System offers a powerful toolset to enhance your trading strategy, reduce risk, and maximize your potential returns. With its combination of trend analysis, momentum detection, and volume filtering, this indicator is designed to help you trade with confidence and precision in any market condition.

Swing Trend AnalysisIntroducing the Swing Trend Analyzer: A Powerful Tool for Swing and Positional Trading
The Swing Trend Analyzer is a cutting-edge indicator designed to enhance your swing and positional trading by providing precise entry points based on volatility contraction patterns and other key technical signals. This versatile tool is packed with features that cater to traders of all timeframes, offering flexibility, clarity, and actionable insights.
Key Features:
1. Adaptive Moving Averages:
The Swing Trend Analyzer offers multiple moving averages tailored to the timeframe you are trading on. On the daily chart, you can select up to four different moving average lengths, while all other timeframes provide three moving averages. This flexibility allows you to fine-tune your analysis according to your trading strategy. Disabling a moving average is as simple as setting its value to zero, making it easy to customize the indicator to your needs.
2. Dynamic Moving Average Colors Based on Relative Strength:
This feature allows you to compare the performance of the current ticker against a major index or any symbol of your choice. The moving average will change color based on whether the ticker is outperforming or underperforming the selected index over the chosen period. For example, on a daily chart, if the 21-day moving average turns blue, it indicates that the ticker has outperformed the selected index over the last 21 days. This visual cue helps you quickly identify relative strength, a key factor in successful swing trading.
3. Visual Identification of Price Contractions:
The Swing Trend Analyzer changes the color of price bars to white (on a dark theme) or black (on a light theme) when a contraction in price is detected. Price contractions are highlighted when either of the following conditions is met: a) the current bar is an inside bar, or b) the price range of the current bar is less than the 14-period Average Daily Range (ADR). This feature makes it easier to spot price contractions across all timeframes, which is crucial for timing entries in swing trading.
4. Overhead Supply Detection with Automated Resistance Lines:
The indicator intelligently detects the presence of overhead supply and draws a single resistance line to avoid clutter on the chart. As price breaches the resistance line, the old line is automatically deleted, and a new resistance line is drawn at the appropriate level. This helps you focus on the most relevant resistance levels, reducing noise and improving decision-making.
5. Buyable Gap Up Marker: The indicator highlights bars in blue when a candle opens with a gap that remains unfilled. These bars are potential Buyable Gap Up (BGU) candidates, signaling opportunities for long-side entries.
6. Comprehensive Swing Trading Information Table:
The indicator includes a detailed table that provides essential data for swing trading:
a. Sector and Industry Information: Understand the sector and industry of the ticker to identify stocks within strong sectors.
b. Key Moving Averages Distances (10MA, 21MA, 50MA, 200MA): Quickly assess how far the current price is from key moving averages. The color coding indicates whether the price is near or far from these averages, offering vital visual cues.
c. Price Range Analysis: Compare the current bar's price range with the previous bar's range to spot contraction patterns.
d. ADR (20, 10, 5): Displays the Average Daily Range over the last 20, 10, and 5 periods, crucial for identifying contraction patterns. On the weekly chart, the ADR continues to provide daily chart information.
e. 52-Week High/Low Data: Shows how close the stock is to its 52-week high or low, with color coding to highlight proximity, aiding in the identification of potential breakout or breakdown candidates.
f. 3-Month Price Gain: See the price gain over the last three months, which helps identify stocks with recent momentum.
7. Pocket Pivot Detection with Visual Markers:
Pocket pivots are a powerful bullish signal, especially relevant for swing trading. Pocket pivots are crucial for swing trading and are effective across all timeframes. The indicator marks pocket pivots with circular markers below the price bar:
a. 10-Day Pocket Pivot: Identified when the volume exceeds the maximum selling volume of the last 10 days. These are marked with a blue circle.
b. 5-Day Pocket Pivot: Identified when the volume exceeds the maximum selling volume of the last 5 days. These are marked with a green circle.
The Swing Trend Analyzer is designed to provide traders with the tools they need to succeed in swing and positional trading. Whether you're looking for precise entry points, analyzing relative strength, or identifying key price contractions, this indicator has you covered. Experience the power of advanced technical analysis with the Swing Trend Analyzer and take your trading to the next level.

FaikValThe "FaikVal" indicator is a powerful tool designed to help traders analyze relative price movements between a base asset and up to three comparison assets. This indicator uses exponential moving averages (EMA) and normalization techniques to identify potential overbought and oversold situations.
Functions and Applications:
Comparison of Price Ratios: The indicator calculates the ratio of the closing price of the base asset to the closing prices of three user-defined comparison assets. This allows for direct comparative analysis and helps identify relative strengths and weaknesses.
EMA Calculations: Two EMAs are calculated for each price ratio (with configurable periods). The difference between these two EMAs serves as the basis for further calculations.
Normalization: The calculated values are normalized over a defined period, helping to smooth out extreme values and facilitate analysis. This normalization transforms the values onto a scale from -100 to 100.
Optional Smoothing: Optional smoothing of the normalized values can be enabled to further reduce short-term fluctuations and generate clearer signals.
Visual Signals: The indicator plots three lines (one for each comparison ratio), representing the normalized values. Additionally, horizontal lines are displayed at +60, -60, and 0 to mark overbought and oversold zones as well as neutral areas.
Customizability: Users can adjust the periods of the EMAs, the length of the normalization period, and the smoothing period. They can also specify which of the three indicators should be displayed.
Applications:
Relative Strength Analysis: Identify whether the base asset is performing stronger or weaker compared to other markets or instruments.
Trend Confirmation: Confirm existing trends by analyzing the movements of the base asset relative to the comparison assets.
Overbought and Oversold Signals: Use the displayed values and horizontal lines to identify potential market turning points and determine entry or exit points.
!!! It works best on the weekly and daily chart for swing trading. It is a set up tool, to determin weather you should go long or short and not a market timing tool. For timing you could use concepts like trend and supply and demand!!!
The "FaikVal" indicator offers versatile and detailed analysis, making it particularly useful for traders seeking deeper insights into relative price strength and weakness.

RSI, STOCHASTIC RSI AND MFI COMBOCombining the Relative Strength Index (RSI), Stochastic RSI (StochRSI), and Money Flow Index (MFI) can provide traders with a comprehensive approach to analyze market momentum, overbought/oversold conditions, and money flow. Each indicator offers unique insights, and their combination can help confirm trading signals and filter out false signals. Let's delve into each indicator and then discuss how they can be used together:
Relative Strength Index (RSI) 14: DA BLUE LINE
The RSI is a momentum oscillator that measures the speed and change of price movements. It oscillates between 0 and 100 and is typically used to identify overbought (>70) and oversold (<30) conditions. A reading above 70 may indicate that an asset is overbought and could be due for a pullback, while a reading below 30 may suggest that an asset is oversold and could be due for a bounce.
Stochastic RSI (StochRSI) 14: DA RED LINE
The StochRSI is an oscillator that combines the features of both the Stochastic Oscillator and RSI. It measures the relative position of the RSI within its range over a specific period (e.g., 14 periods). Like the RSI, the StochRSI oscillates between 0 and 100 and is used to identify overbought and oversold conditions. Typically:
A StochRSI above 0.8 may suggest overbought conditions.
A StochRSI below 0.2 may indicate oversold conditions.
Money Flow Index (MFI) 14: DA PURPLE LINE
The MFI is a momentum oscillator that measures the inflow and outflow of money into an asset over a specific period (e.g., 14 periods). It oscillates between 0 and 100 and is used to identify overbought and oversold conditions based on both price and volume. Generally:
An MFI above 80 may indicate overbought conditions.
An MFI below 20 may suggest oversold conditions.
Combining RSI, StochRSI, and MFI:
When combining RSI, StochRSI, and MFI, traders can use the following approach to analyze the market:
Identify Overbought/Oversold Conditions:
Look for confluence between RSI, StochRSI, and MFI readings to identify overbought and oversold conditions.
For example, if RSI > 70, StochRSI > 0.8, and MFI > 80, it may suggest a strong overbought condition, potentially indicating a reversal or pullback.
Confirm Trend Strength:
Use the RSI, StochRSI, and MFI to confirm the strength of a trend.
A rising trend with RSI, StochRSI, and MFI above 50 may suggest strong bullish momentum, while a falling trend with readings below 50 may indicate strong bearish momentum.
Divergence Analysis:
Look for divergences between price and RSI, StochRSI, or MFI to identify potential trend reversals.
For example, if the price makes a higher high, but RSI, StochRSI, or MFI makes a lower high (bearish divergence), it may suggest weakening bullish momentum and potential downside.
Combining RSI, StochRSI, and MFI can offer traders a more holistic view of market momentum, overbought/oversold conditions, and money flow. Backtest it let me know your success.

Gorb AlgoIntroduction:
Gorb Algo is an all-in-one trading indicator made up of classic technical analysis components such as moving averages, relative strength index, stochastic oscillator, and pivot points blended together to create a synergistic algorithm. Focused on providing useful signals & trading tool overlays to meet all trader's technical analysis needs. Each feature included can be changed to meet each traders strategy or market condition.
Overview:
The Gorb Market Trend isn't a simple trend-following tool; it's a sophisticated blend of traditional and innovative methods, providing comprehensive market analysis.
Its unique combination of EMA analysis, volume weighting, RSI, and stochastic indicators, along with proprietary algorithms, providing nuanced views in trend detection and trading confluences.
The indicator is designed for traders at all levels, offering a balance of depth for experienced traders and simplicity for beginners.
Centerpieces: Gorb Market Trend & Volume Strength
These use a color-coded system to indicate market direction/strength. The color: white is used to signal upward/bullish trend, while the color: purple is used to signal downward/bearish trend. It is designed for ease of use, simplifying complex market data into an easy visually understandable format.
How the Gorb Market Trend Works:
Moving averages are used to find convergence or divergence on multiple EMA's to help determine the overall market direction. Relative Strength Index is used to assess the speed and change of price movements to add another layer to the Market Trend lines identification of the markets analysis. It then plots a line using just two colors to provide traders with a visual representation of the trend. This can help traders quickly grasp the current market trend with simple color cues.
How the Volume Strength Works:
A stochastic oscillator is used to measure the current price level relative to its price over a specific range period to capture sentiment and potential reversals for the Trend Strength feature. And the final part is the use of VWAP and volume analysis to ensure that identified trends are not only based on price movements but are also supported by trading volume, adding a layer of reliability to the trend signals. These are then plotted at the bottom of the chart following the same color scheme as Gorb Market Trend. Only difference is, when volume strength begins to decline, the color will be more transparent, and when it is strong, the color will be bright.
Custom Algorithmic Elements:
The Gorb Market Trend isn't just a combination of standard indicators. It includes proprietary algorithmic elements tailored to enhance signal accuracy and timing. These unique components are what set the Gorb Market Trend apart from conventional trend-detection methods.
We recommend exploring every feature to pick & choose what best suits your needs and style of trading, and use that to combine with the Market trend line.
Features:
All skill-level friendly presets, easy to enable features with one-click
Trading Signals: Plotted signals to help traders identify changes in trend on the Gorb Market Trend Line (not to be followed blindly)
Match Volume Color: allows the user to enable signals to appear only if they match the trend strength's color
Enable MA Filter: allows the user to use 2 EMA's to create a custom trend filter in order to limit contrarian signals with the current trend
Chop Filter: allows the user to have a specific candle range of their choice to limit signals during sideways price movement
4 EMA's: allows the user to plot up to 4 EMA's on the chart and change to the users specific trading strategy with the Market Trend line
VWAP: allows users to plot VWAP on their chart to visually see where price is relatively
EMA Clouds: allows users to fill the gap between EMA's plotted on the chart to help them visualize zones for entries or stop-losses
Pivot Points: allows users to have pivots on their chart to use in tandem with market trend line to find areas of support and resistance to help find confluence in their trading
All colors are changeable for the user to customize the scheme to their liking or style
Basic Signals, Market Trend & Volume Strength Demonstration
In the image below, we can see a basic example of how these 3 core features function.
As explained above, the trade ideas are only generated if the user enables them. They will plot as small triangles in real time and are directly correlated to the market trend line coloring in order to quickly see the change in market conditions.
The volume strength on the bottom helps identify the strength and momentum of the market condition. This can also be used to identify possible fake-outs or small pullbacks before price continues on. The brighter the volume strength the stronger it is, when it is dimmer, that means volume is decreasing in that direction. This can help traders identify signals they may not want to trust as much.
Trading Tool Overlays with Signals
In the image below, we have enabled the EMA's and VWAP overlays from the settings. By using these tools, users can add more confluence to create their trading strategies
The EMA's are not only used for the market trends, trend filter. But also used as an additional confluence for general trend following purposes alongside the trade idea signals. These can be extremely useful for traders who like to have different length moving averages depending on their timeframe for analyzing the market.
In this next image, we can see that price dips down and then bounces up. With EMA clouds enabled, the user can now have visual zones to look for trade entries in.
When paired with the market trend line and trade idea signals, this adds a whole other level of easy visual trading confluence for traders. You can see that market trend changes color and a trade signal is plotted when price enters these zones. This can be helpful to a trader looking to find confluence in their entries.
The image below shows specific pivot levels being plotted when the user enabled pivots in the settings of the indicator.
The pivot levels proved an excellent area of support/resistance for traders that are generated fresh every day. These are particularly useful for areas that line up with previous tools above and trade signals. This overlay gives traders a clear level that can be used to confirm entries and create targets to exit trades at. These levels when combined with the other tools in this indicator provide traders an all-in-one visual confluences. Some traders may just use this overlay to have an idea on the range for the trading session.
Filters:
There are 3 different trade signal filters integrated into this indicator
1. Match Volume Color: When enabled, signals can only be valid and plotted if the volume strength color matches the market trend line signal. Otherwise the signal will not appear, this limits possible fake-outs without having volume agree.
2. MA Filter: When enabled, this removes an contrarian signals to the current market trend per the settings of the filter. The EMA settings for this filter can be changed by the user for them to customize this to their trading strategies. There are two settings, short ema and long ema to define the trend.
3. Chop Filter: When enabled, this disables signals that would normally appear in sideways price action. This setting is also customizable by the user; there are two settings: candle period and threshold. The candle period is how many candles back does this filter want to look to define its range. The threshold, is the amount of price deviation is allowed from this range in order to disable a signal.
Conclusion:
We believe in providing an all inclusive trading tool to help simplify trading for all traders. The goal is to provide a user-friendly, efficient tool that provides insights into market trends. For it to stand out for its simplicity and effectiveness, as a support tool for decision making.
How to get access:
You can see the Author's instructions to get access to this indicator
RISK DISCLAIMER
All content, tools, scripts & education provided by Monstanzer or Gorb Algo LLC are for informational & educational purposes only. Trading is risk and most lose their money, past performance does not guarantee future results.
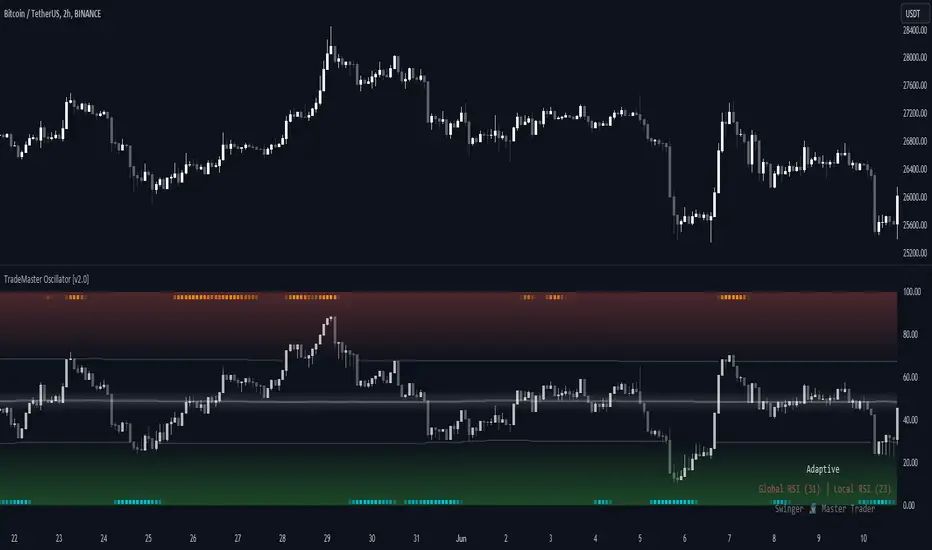
TradeMaster OscillatorTrading effectively requires a range of techniques, experience, and expertise. From technical analysis to market fundamentals, traders must navigate multiple factors, including market sentiment and economic conditions. However, traders often find themselves overwhelmed by market noise, making it challenging to filter out distractions and make informed decisions. To address this, we present a powerful indicator package designed to assist traders on their journey to success.
The TradeMaster indicator package encompasses a variety of trading strategies, including the SMC (Supply, Demand, and Price Action) approach, along with many other techniques. By leveraging concepts such as price action trading, support and resistance analysis, supply and demand dynamics, these indicators empower traders to analyze entry and exit positions with precision. Unlike other forms of technical analysis that produce values or plots based on historical price data, Price Action brings you the facts straight from the source - the current price movements.
The indicator package consists of three powerful indicators that can be used individually or together to maximize trading effectiveness.
⭐ About the Oscillator Indicator
The Oscillator is an innovative and robust tool that encapsulates the principles of multiple technical analysis methodologies to enrich your trading strategy. By leveraging the combination of our six unique indicators, it can provide a comprehensive and multi-dimensional view of market dynamics.
👉 Usage - the general approach:
Utilize the Oscillator Indicator as a confirmational tool. The Oscillator acts as a tool to validate ideas and strategies. By analyzing the oscillator's readings, you gain additional insights into market momentum, overbought or oversold conditions, and potential trend reversals. This confirmation step helps you avoid false signals and make more informed trading choices.
👉 We are focusing on the default setting of the TradeMaster Oscillator, which incorporates the Global RSI* as main oscillator and Local RSI* as confirmational oscillator. This base configuration can be custom-tailored to your preference, leveraging the additional combination of our six unique indicators.
Understand the difference between Global and Local RSI: The Global RSI represents broad relative strength, while the Local RSI describes the relative strength within wider movements. It's like having both a macro and micro view of relative strength.
Identify extreme values in Local RSI: Look for extremes in the Local RSI (overbought/oversold in Stochastic RSI). These often indicate a turning point in the RSI, which naturally reflects in the price. The Local RSI extremes are shown as dots outside the Global RSI bands in a "heatmap" style.
Smooth your RSI: You have the option to smooth your RSI with your preferred smoothing method (SMA , SMMA, EMA, DEMA, TEMA, LSMA, HMA, VWMA, WMA) and length.
Please bear in mind that high smoothing values can make the standard RSI extremes (>70 or <30) suboptimal or even useless. To address this potential problem, Adaptive levels were introduced.
Adaptive key levels for more relevant extremes: enabling Adaptive levels recalibrates extremes based on the historical RSI turning points (typical median turning points), providing much more relevant reference points for overbought/oversold states in both Global and Local RSI. This function can be used without smoothing but rarely provides significant difference unless you experiment with the length of RSI calculation.
Incorporate multiple indicators: besides Global and Local RSI, you can display six different proprietary indicators in the main oscillator theme. By choosing from these, you can apply the confirming condition as well. These include Sentiment (Fear and greed), Momentum, Trend Strength, Volume, and Volatility. These indicators use our TRMA** method to provide a comprehensive overview of market dynamics.
Choose your Global RSI display style: the Global RSI can be represented in candle, bar, line or ribbon form. Candles and bars can be useful for detecting rejections of relative strength (wicks), similar to OHLC data. Sometimes there are "hidden rejections" visible in relative strength but not in OHLC data, which naturally presents an advantage.
Customize the colors: All colors can be adjusted from the input menu to suit your preferences. This personalization allows you to make the Oscillator clear and intuitive for your individual trading style as possible.
Monitor Real-time Indicator values: In the bottom right corner, you can view real-time color-coded indicator values. This feature gives you the ability to quickly assess the market's current conditions without needing to navigate away from the chart.
Use multiple indicators in conjunction: while each indicator within the Oscillator provides valuable insights, their true power lies in their combination. Identify alignment among indicators to validate potential trades. For instance, when a bullish sentiment indication aligns with a low volatility reading, it may suggest a favorable buying opportunity.
Consider the market context: while the Oscillator provides a robust set of tools, always consider other aspects of the market environment. Use the oscillator in conjunction with other technical, fundamental, or sentiment analysis methods to develop a comprehensive trading strategy.
🛑 Remember, the oscillator should be used as a confirmational tool in your overall trading strategy. Make reasonable use of all its features, and always keep risk management principles in mind.
* By default, these are fine-tuned RSI and Stochastic RSI indicators.
** TRMA (Trend Rainbow Moving Averages) is a complex but customizable moving average matrix calculation that is designed to accurately measure market trend direction, strength and shifting.
⭐ Conclusion
We hold the view that the true path to success is the synergy between the trader and the tool, contrary to the common belief that the tool itself is the sole determinant of profitability. The actual scenario is more nuanced than such an oversimplification. Our aim is to offer useful features that meet the needs of the 21st century and that we actually use.
🛑 Risk Notice:
Everything provided by trademasterindicator – from scripts, tools, and articles to educational materials – is intended solely for educational and informational purposes. Past performance does not assure future returns.
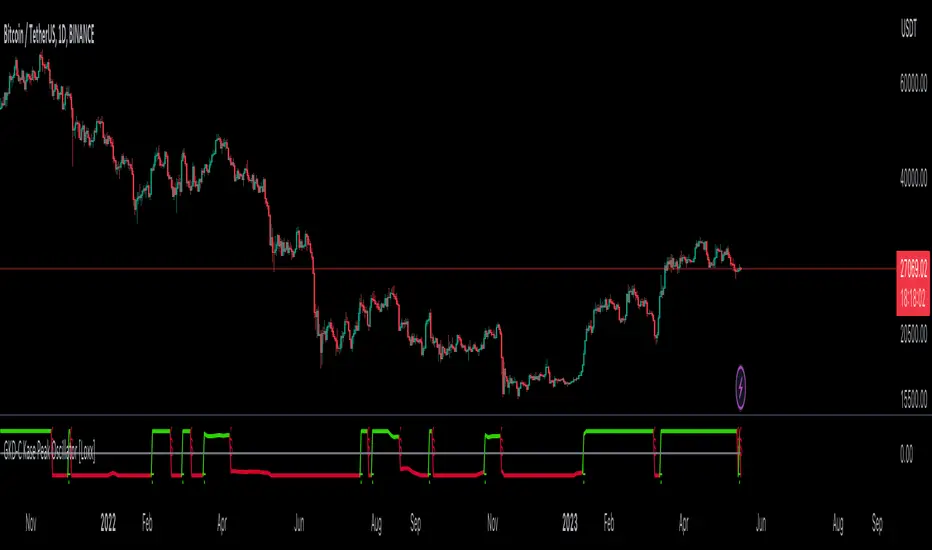
GKD-C Kase Peak Oscillator [Loxx]Giga Kaleidoscope GKD-C Kase Peak Oscillator is a Metamorphosis module included in Loxx's "Giga Kaleidoscope Modularized Trading System".
█ GKD-C Kase Peak Oscillator
The Kase Peak Oscillator is a technical analysis tool developed by Cynthia Kase, a renowned market analyst and trader. It is used by traders and investors to identify trading signals and potential trend reversals in financial markets.
The Kase Peak Oscillator utilizes a unique approach to measuring momentum and trend strength. It is calculated by measuring the difference between the highest high and lowest low prices over a set period of time and then smoothing these values using a moving average. This smoothing reduces the impact of market noise and helps to identify clearer trends.
The indicator is similar to other momentum oscillators, but its calculation is distinct in several ways. One significant feature is that the Kase Peak Oscillator generates data points that are not bounded, meaning that the indicator can take on positive and negative values regardless of market direction. This enables traders to identify potential buy and sell signals across different market conditions.
Traders use the Kase Peak Oscillator primarily to identify potential trading opportunities and strategy decisions. When the oscillator crosses above a certain level, traders view it as a bullish signal, indicating a potential buying opportunity. Conversely, when the oscillator crosses below a specific level, traders see it as a bearish signal, indicating a potential selling opportunity.
█ Giga Kaleidoscope Modularized Trading System
Core components of an NNFX algorithmic trading strategy
The NNFX algorithm is built on the principles of trend, momentum, and volatility. There are six core components in the NNFX trading algorithm:
1. Volatility - price volatility; e.g., Average True Range, True Range Double, Close-to-Close, etc.
2. Baseline - a moving average to identify price trend
3. Confirmation 1 - a technical indicator used to identify trends
4. Confirmation 2 - a technical indicator used to identify trends
5. Continuation - a technical indicator used to identify trends
6. Volatility/Volume - a technical indicator used to identify volatility/volume breakouts/breakdown
7. Exit - a technical indicator used to determine when a trend is exhausted
8. Metamorphosis - a technical indicator that produces a compound signal from the combination of other GKD indicators*
*(not part of the NNFX algorithm)
What is Volatility in the NNFX trading system?
In the NNFX (No Nonsense Forex) trading system, ATR (Average True Range) is typically used to measure the volatility of an asset. It is used as a part of the system to help determine the appropriate stop loss and take profit levels for a trade. ATR is calculated by taking the average of the true range values over a specified period.
True range is calculated as the maximum of the following values:
-Current high minus the current low
-Absolute value of the current high minus the previous close
-Absolute value of the current low minus the previous close
ATR is a dynamic indicator that changes with changes in volatility. As volatility increases, the value of ATR increases, and as volatility decreases, the value of ATR decreases. By using ATR in NNFX system, traders can adjust their stop loss and take profit levels according to the volatility of the asset being traded. This helps to ensure that the trade is given enough room to move, while also minimizing potential losses.
Other types of volatility include True Range Double (TRD), Close-to-Close, and Garman-Klass
What is a Baseline indicator?
The baseline is essentially a moving average, and is used to determine the overall direction of the market.
The baseline in the NNFX system is used to filter out trades that are not in line with the long-term trend of the market. The baseline is plotted on the chart along with other indicators, such as the Moving Average (MA), the Relative Strength Index (RSI), and the Average True Range (ATR).
Trades are only taken when the price is in the same direction as the baseline. For example, if the baseline is sloping upwards, only long trades are taken, and if the baseline is sloping downwards, only short trades are taken. This approach helps to ensure that trades are in line with the overall trend of the market, and reduces the risk of entering trades that are likely to fail.
By using a baseline in the NNFX system, traders can have a clear reference point for determining the overall trend of the market, and can make more informed trading decisions. The baseline helps to filter out noise and false signals, and ensures that trades are taken in the direction of the long-term trend.
What is a Confirmation indicator?
Confirmation indicators are technical indicators that are used to confirm the signals generated by primary indicators. Primary indicators are the core indicators used in the NNFX system, such as the Average True Range (ATR), the Moving Average (MA), and the Relative Strength Index (RSI).
The purpose of the confirmation indicators is to reduce false signals and improve the accuracy of the trading system. They are designed to confirm the signals generated by the primary indicators by providing additional information about the strength and direction of the trend.
Some examples of confirmation indicators that may be used in the NNFX system include the Bollinger Bands, the MACD (Moving Average Convergence Divergence), and the MACD Oscillator. These indicators can provide information about the volatility, momentum, and trend strength of the market, and can be used to confirm the signals generated by the primary indicators.
In the NNFX system, confirmation indicators are used in combination with primary indicators and other filters to create a trading system that is robust and reliable. By using multiple indicators to confirm trading signals, the system aims to reduce the risk of false signals and improve the overall profitability of the trades.
What is a Continuation indicator?
In the NNFX (No Nonsense Forex) trading system, a continuation indicator is a technical indicator that is used to confirm a current trend and predict that the trend is likely to continue in the same direction. A continuation indicator is typically used in conjunction with other indicators in the system, such as a baseline indicator, to provide a comprehensive trading strategy.
What is a Volatility/Volume indicator?
Volume indicators, such as the On Balance Volume (OBV), the Chaikin Money Flow (CMF), or the Volume Price Trend (VPT), are used to measure the amount of buying and selling activity in a market. They are based on the trading volume of the market, and can provide information about the strength of the trend. In the NNFX system, volume indicators are used to confirm trading signals generated by the Moving Average and the Relative Strength Index. Volatility indicators include Average Direction Index, Waddah Attar, and Volatility Ratio. In the NNFX trading system, volatility is a proxy for volume and vice versa.
By using volume indicators as confirmation tools, the NNFX trading system aims to reduce the risk of false signals and improve the overall profitability of trades. These indicators can provide additional information about the market that is not captured by the primary indicators, and can help traders to make more informed trading decisions. In addition, volume indicators can be used to identify potential changes in market trends and to confirm the strength of price movements.
What is an Exit indicator?
The exit indicator is used in conjunction with other indicators in the system, such as the Moving Average (MA), the Relative Strength Index (RSI), and the Average True Range (ATR), to provide a comprehensive trading strategy.
The exit indicator in the NNFX system can be any technical indicator that is deemed effective at identifying optimal exit points. Examples of exit indicators that are commonly used include the Parabolic SAR, the Average Directional Index (ADX), and the Chandelier Exit.
The purpose of the exit indicator is to identify when a trend is likely to reverse or when the market conditions have changed, signaling the need to exit a trade. By using an exit indicator, traders can manage their risk and prevent significant losses.
In the NNFX system, the exit indicator is used in conjunction with a stop loss and a take profit order to maximize profits and minimize losses. The stop loss order is used to limit the amount of loss that can be incurred if the trade goes against the trader, while the take profit order is used to lock in profits when the trade is moving in the trader's favor.
Overall, the use of an exit indicator in the NNFX trading system is an important component of a comprehensive trading strategy. It allows traders to manage their risk effectively and improve the profitability of their trades by exiting at the right time.
What is an Metamorphosis indicator?
The concept of a metamorphosis indicator involves the integration of two or more GKD indicators to generate a compound signal. This is achieved by evaluating the accuracy of each indicator and selecting the signal from the indicator with the highest accuracy. As an illustration, let's consider a scenario where we calculate the accuracy of 10 indicators and choose the signal from the indicator that demonstrates the highest accuracy.
The resulting output from the metamorphosis indicator can then be utilized in a GKD-BT backtest by occupying a slot that aligns with the purpose of the metamorphosis indicator. The slot can be a GKD-B, GKD-C, or GKD-E slot, depending on the specific requirements and objectives of the indicator. This allows for seamless integration and utilization of the compound signal within the GKD-BT framework.
How does Loxx's GKD (Giga Kaleidoscope Modularized Trading System) implement the NNFX algorithm outlined above?
Loxx's GKD v2.0 system has five types of modules (indicators/strategies). These modules are:
1. GKD-BT - Backtesting module (Volatility, Number 1 in the NNFX algorithm)
2. GKD-B - Baseline module (Baseline and Volatility/Volume, Numbers 1 and 2 in the NNFX algorithm)
3. GKD-C - Confirmation 1/2 and Continuation module (Confirmation 1/2 and Continuation, Numbers 3, 4, and 5 in the NNFX algorithm)
4. GKD-V - Volatility/Volume module (Confirmation 1/2, Number 6 in the NNFX algorithm)
5. GKD-E - Exit module (Exit, Number 7 in the NNFX algorithm)
6. GKD-M - Metamorphosis module (Metamorphosis, Number 8 in the NNFX algorithm, but not part of the NNFX algorithm)
(additional module types will added in future releases)
Each module interacts with every module by passing data to A backtest module wherein the various components of the GKD system are combined to create a trading signal.
That is, the Baseline indicator passes its data to Volatility/Volume. The Volatility/Volume indicator passes its values to the Confirmation 1 indicator. The Confirmation 1 indicator passes its values to the Confirmation 2 indicator. The Confirmation 2 indicator passes its values to the Continuation indicator. The Continuation indicator passes its values to the Exit indicator, and finally, the Exit indicator passes its values to the Backtest strategy.
This chaining of indicators requires that each module conform to Loxx's GKD protocol, therefore allowing for the testing of every possible combination of technical indicators that make up the six components of the NNFX algorithm.
What does the application of the GKD trading system look like?
Example trading system:
Backtest: Full GKD Backtest
Baseline: Hull Moving Average
Volatility/Volume: Hurst Exponent
Confirmation 1: Kase Peak Oscillator as shown in the chart above
Confirmation 2: uf2018
Continuation: Vortex
Exit: Rex Oscillator
Metamorphosis: Fisher Transform, Universal Oscillator, Aroon, Vortex .. combined
Each GKD indicator is denoted with a module identifier of either: GKD-BT, GKD-B, GKD-C, GKD-V, GKD-M, or GKD-E. This allows traders to understand to which module each indicator belongs and where each indicator fits into the GKD system.
█ Giga Kaleidoscope Modularized Trading System Signals
Standard Entry
1. GKD-C Confirmation gives signal
2. Baseline agrees
3. Price inside Goldie Locks Zone Minimum
4. Price inside Goldie Locks Zone Maximum
5. Confirmation 2 agrees
6. Volatility/Volume agrees
1-Candle Standard Entry
1a. GKD-C Confirmation gives signal
2a. Baseline agrees
3a. Price inside Goldie Locks Zone Minimum
4a. Price inside Goldie Locks Zone Maximum
Next Candle
1b. Price retraced
2b. Baseline agrees
3b. Confirmation 1 agrees
4b. Confirmation 2 agrees
5b. Volatility/Volume agrees
Baseline Entry
1. GKD-B Basline gives signal
2. Confirmation 1 agrees
3. Price inside Goldie Locks Zone Minimum
4. Price inside Goldie Locks Zone Maximum
5. Confirmation 2 agrees
6. Volatility/Volume agrees
7. Confirmation 1 signal was less than 'Maximum Allowable PSBC Bars Back' prior
1-Candle Baseline Entry
1a. GKD-B Baseline gives signal
2a. Confirmation 1 agrees
3a. Price inside Goldie Locks Zone Minimum
4a. Price inside Goldie Locks Zone Maximum
5a. Confirmation 1 signal was less than 'Maximum Allowable PSBC Bars Back' prior
Next Candle
1b. Price retraced
2b. Baseline agrees
3b. Confirmation 1 agrees
4b. Confirmation 2 agrees
5b. Volatility/Volume agrees
Volatility/Volume Entry
1. GKD-V Volatility/Volume gives signal
2. Confirmation 1 agrees
3. Price inside Goldie Locks Zone Minimum
4. Price inside Goldie Locks Zone Maximum
5. Confirmation 2 agrees
6. Baseline agrees
7. Confirmation 1 signal was less than 7 candles prior
1-Candle Volatility/Volume Entry
1a. GKD-V Volatility/Volume gives signal
2a. Confirmation 1 agrees
3a. Price inside Goldie Locks Zone Minimum
4a. Price inside Goldie Locks Zone Maximum
5a. Confirmation 1 signal was less than 'Maximum Allowable PSVVC Bars Back' prior
Next Candle
1b. Price retraced
2b. Volatility/Volume agrees
3b. Confirmation 1 agrees
4b. Confirmation 2 agrees
5b. Baseline agrees
Confirmation 2 Entry
1. GKD-C Confirmation 2 gives signal
2. Confirmation 1 agrees
3. Price inside Goldie Locks Zone Minimum
4. Price inside Goldie Locks Zone Maximum
5. Volatility/Volume agrees
6. Baseline agrees
7. Confirmation 1 signal was less than 7 candles prior
1-Candle Confirmation 2 Entry
1a. GKD-C Confirmation 2 gives signal
2a. Confirmation 1 agrees
3a. Price inside Goldie Locks Zone Minimum
4a. Price inside Goldie Locks Zone Maximum
5a. Confirmation 1 signal was less than 'Maximum Allowable PSC2C Bars Back' prior
Next Candle
1b. Price retraced
2b. Confirmation 2 agrees
3b. Confirmation 1 agrees
4b. Volatility/Volume agrees
5b. Baseline agrees
PullBack Entry
1a. GKD-B Baseline gives signal
2a. Confirmation 1 agrees
3a. Price is beyond 1.0x Volatility of Baseline
Next Candle
1b. Price inside Goldie Locks Zone Minimum
2b. Price inside Goldie Locks Zone Maximum
3b. Confirmation 1 agrees
4b. Confirmation 2 agrees
5b. Volatility/Volume agrees
Continuation Entry
1. Standard Entry, 1-Candle Standard Entry, Baseline Entry, 1-Candle Baseline Entry, Volatility/Volume Entry, 1-Candle Volatility/Volume Entry, Confirmation 2 Entry, 1-Candle Confirmation 2 Entry, or Pullback entry triggered previously
2. Baseline hasn't crossed since entry signal trigger
4. Confirmation 1 agrees
5. Baseline agrees
6. Confirmation 2 agrees
█ Connecting to Backtests
All GKD indicators are chained indicators meaning you export the value of the indicators to specialized backtest to creat your GKD trading system. Each indicator contains a proprietary signal generation algo that will only work with GKD backtests. You can find these backtests using the links below.
GKD-BT Giga Confirmation Stack Backtest:
GKD-BT Giga Stacks Backtest:
GKD-BT Full Giga Kaleidoscope Backtest:
GKD-BT Solo Confirmation Super Complex Backtest:
GKD-BT Solo Confirmation Complex Backtest:
GKD-BT Solo Confirmation Simple Backtest:
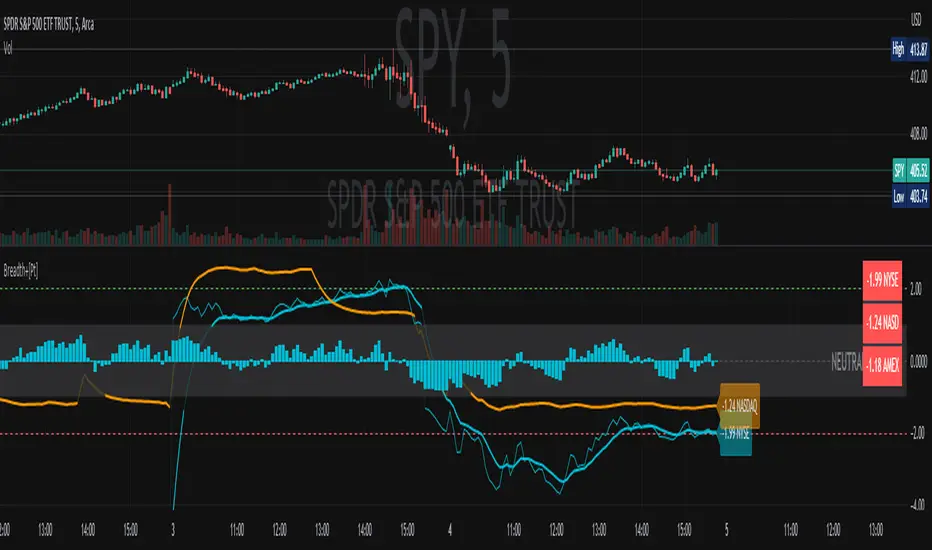
Market Breadth Ratio+ [Pt]This is a + version of my original Market Breadth Ratio Indicator
DESCRIPTION
The Market Breadth Ratio+ indicator is a tool that can help traders gain a more comprehensive understanding of market breadth by providing a ratio between Up volume (UVOL) and Down volume (DVOL).
While the VOLD indicator provides a straightforward measure of the difference between UVOL and DVOL, it doesn't account for the rate of change. The Market Breadth Ratio+ indicator, on the other hand, takes the rate of change into account, providing a plot line that is easier to interpret and understand.
The Up Volume vs Down Volume Ratios measure the strength of buying versus selling pressure in the market. A ratio greater than 1 indicates that there is more buying pressure, while a ratio less than -1 indicates more selling pressure. The ratio is calculated by dividing the total volume of stocks that closed up on the day by the total volume of stocks that closed down.
|| ------------------------------------------------------------------------------------------------------------------------------------------------------------------------------------||
This script includes the following premium unique features.
1) Custom Moving Average line for Breadth Ratio line. There are a few MA type to choose from: SMA, EMA, RMA, WMA, VWMA, HMA
- This feature provide a smoother plot for better interpretation of the market trend
- MA crossovers can also be used as trend reversal signals
2) Breadth Strength Index (BSI)
- This graph shows the relative strength of the Breadth Ratio. This is a momentum based oscillator that measure the rate of change of the Breadth Ratio. It shows the strength and weakness in the Breadth Ratio plot.
- A bar close to 1 means the market is very strong in the Bullish direction, conversely, a bar close to -1 means the market is very weak, but very strong in the Bearish direction
- Above 0 shows Bullish strength
- Below 0 shows Bearish strength
3) Two display modes for Breadth Strength Index
- Histogram
- Line
- These can be combined to show different markets together, such as NYSE and NASDAQ
4) Custom Moving Average can be applied to the BSI
- This will provide smoother graph for easier interpretation
5) Aggregated Market Strength
- This feature combines the BSI of multiple markets, such as NYSE and NASDAQ, to provide a more comprehensive view of the overall US market. Often time, one of these indices will have a stronger 'pull' on the entire market. By observing the dominant color (of your choosing), you can see which index is pulling the market. And by trading the market that has the bigger pull, traders can leverage on the possible higher volatility for greater trade opportunities.
6) Custom Moving Average can be applied to the Aggregated Market Strength
- This will provide smoother graph for easier interpretation
7) Show alternating trend colors on Aggregated Market Strength
- This provides an intuitive view of the market strength that's based on market breadth ratio
GKD-V Cercos Chaos vs Movement [Loxx]Giga Kaleidoscope GKD-V Cercos Chaos vs Movement is a Volatility/Volume module included in Loxx's "Giga Kaleidoscope Modularized Trading System".
█ GKD-V Cercos Chaos vs Movement
The following aims to provide a detailed explanation of Cercos Chaos vs Movement that helps traders determine market volatility by comparing two different measures: Buffer Move and Buffer Chaos. This indicator is non-directional and should be paired with a directional indicator to provide trading signals.
The first step in the process is defining a custom function that implements a variant of the sigmoid function. This function has a parameter that allows the output to be limited to the range of if desired. The sigmoid function will later be used to normalize the Buffer Chaos value.
Next, several input parameters are introduced, which can be adjusted by the user. These parameters include the period, chaos strength, chaos width, and movement strength. These values are essential to customizing the behavior of the indicator and adapting it to different market conditions and trading styles.
The wicks of the candles in the given time series are then calculated by subtracting the absolute difference between the open and close prices from the difference between the high and low prices. This step is crucial in determining the level of volatility in the market.
Subsequently, the highest high and lowest low over the defined period are identified by examining the maximum and minimum values of the open and close prices. This information is essential for calculating the total movement in the market over the period being analyzed.
Once the highest high and lowest low are found, the Buffer Move and Buffer Chaos values are calculated. The Buffer Move is the sum of the differences between the high and low prices for each candle in the period. This measure helps to identify the overall price movement in the market during the period.
On the other hand, the Buffer Chaos represents the sum of the wicks' lengths for each candle in the period. This measure is used to identify the level of uncertainty and disorder in the market during the period.
In the next step, the total movement in the market is calculated by subtracting the lowest low from the highest high. This value is then used to normalize the Buffer Move and Buffer Chaos values, ensuring they are on a comparable scale.
A comparison is made between the normalized Buffer Move and Buffer Chaos values. If the Buffer Move value is greater than the Buffer Chaos value, it indicates that there is enough volatility in the market to trade long or short. In such a case, the indicator suggests that the market conditions are favorable for trading. However, as this indicator is non-directional, a directional indicator should be used in conjunction with it to provide trading signals.
In conclusion, this custom trading indicator provides valuable insights into market volatility by comparing the Buffer Move and Buffer Chaos values. By offering a non-directional perspective, traders can use this indicator to gauge the potential for profitable trades and make informed decisions by pairing it with a directional indicator.
Additional Features
This indicator allows you to select from 33 source types. They are as follows:
Close
Open
High
Low
Median
Typical
Weighted
Average
Average Median Body
Trend Biased
Trend Biased (Extreme)
HA Close
HA Open
HA High
HA Low
HA Median
HA Typical
HA Weighted
HA Average
HA Average Median Body
HA Trend Biased
HA Trend Biased (Extreme)
HAB Close
HAB Open
HAB High
HAB Low
HAB Median
HAB Typical
HAB Weighted
HAB Average
HAB Average Median Body
HAB Trend Biased
HAB Trend Biased (Extreme)
What are Heiken Ashi "better" candles?
Heiken Ashi "better" candles are a modified version of the standard Heiken Ashi candles, which are a popular charting technique used in technical analysis. Heiken Ashi candles help traders identify trends and potential reversal points by smoothing out price data and reducing market noise. The "better formula" was proposed by Sebastian Schmidt in an article published by BNP Paribas in Warrants & Zertifikate, a German magazine, in August 2004. The aim of this formula is to further improve the smoothing of the Heiken Ashi chart and enhance its effectiveness in identifying trends and reversals.
Standard Heiken Ashi candles are calculated using the following formulas:
Heiken Ashi Close = (Open + High + Low + Close) / 4
Heiken Ashi Open = (Previous Heiken Ashi Open + Previous Heiken Ashi Close) / 2
Heiken Ashi High = Max (High, Heiken Ashi Open, Heiken Ashi Close)
Heiken Ashi Low = Min (Low, Heiken Ashi Open, Heiken Ashi Close)
The "better formula" modifies the standard Heiken Ashi calculation by incorporating additional smoothing, which can help reduce noise and make it easier to identify trends and reversals. The modified formulas for Heiken Ashi "better" candles are as follows:
Better Heiken Ashi Close = (Open + High + Low + Close) / 4
Better Heiken Ashi Open = (Previous Better Heiken Ashi Open + Previous Better Heiken Ashi Close) / 2
Better Heiken Ashi High = Max (High, Better Heiken Ashi Open, Better Heiken Ashi Close)
Better Heiken Ashi Low = Min (Low, Better Heiken Ashi Open, Better Heiken Ashi Close)
Smoothing Factor = 2 / (N + 1), where N is the chosen period for smoothing
Smoothed Better Heiken Ashi Open = (Better Heiken Ashi Open * Smoothing Factor) + (Previous Smoothed Better Heiken Ashi Open * (1 - Smoothing Factor))
Smoothed Better Heiken Ashi Close = (Better Heiken Ashi Close * Smoothing Factor) + (Previous Smoothed Better Heiken Ashi Close * (1 - Smoothing Factor))
The smoothed Better Heiken Ashi Open and Close values are then used to calculate the smoothed Better Heiken Ashi High and Low values, resulting in "better" candles that provide a clearer representation of the market trend and potential reversal points.
It's important to note that, like any other technical analysis tool, Heiken Ashi "better" candles are not foolproof and should be used in conjunction with other indicators and analysis techniques to make well-informed trading decisions.
Heiken Ashi "better" candles, as mentioned previously, provide a clearer representation of market trends and potential reversal points by reducing noise and smoothing out price data. When using these candles in conjunction with other technical analysis tools and indicators, traders can gain valuable insights into market behavior and make more informed decisions.
To effectively use Heiken Ashi "better" candles in your trading strategy, consider the following tips:
Trend Identification: Heiken Ashi "better" candles can help you identify the prevailing trend in the market. When the majority of the candles are green (or another color, depending on your chart settings) and there are no or few lower wicks, it may indicate a strong uptrend. Conversely, when the majority of the candles are red (or another color) and there are no or few upper wicks, it may signal a strong downtrend.
Trend Reversals: Look for potential trend reversals when a change in the color of the candles occurs, especially when accompanied by longer wicks. For example, if a green candle with a long lower wick is followed by a red candle, it could indicate a bearish reversal. Similarly, a red candle with a long upper wick followed by a green candle may suggest a bullish reversal.
Support and Resistance: You can use Heiken Ashi "better" candles to identify potential support and resistance levels. When the candles are consistently moving in one direction and then suddenly change color with longer wicks, it could indicate the presence of a support or resistance level.
Stop-Loss and Take-Profit: Using Heiken Ashi "better" candles can help you manage risk by determining optimal stop-loss and take-profit levels. For instance, you can place your stop-loss below the low of the most recent green candle in an uptrend or above the high of the most recent red candle in a downtrend.
Confirming Signals: Heiken Ashi "better" candles should be used in conjunction with other technical indicators, such as moving averages, oscillators, or chart patterns, to confirm signals and improve the accuracy of your analysis.
In this implementation, you have the choice of AMA, KAMA, or T3 smoothing. These are as follows:
Kaufman Adaptive Moving Average (KAMA)
The Kaufman Adaptive Moving Average (KAMA) is a type of adaptive moving average used in technical analysis to smooth out price fluctuations and identify trends. The KAMA adjusts its smoothing factor based on the market's volatility, making it more responsive in volatile markets and smoother in calm markets. The KAMA is calculated using three different efficiency ratios that determine the appropriate smoothing factor for the current market conditions. These ratios are based on the noise level of the market, the speed at which the market is moving, and the length of the moving average. The KAMA is a popular choice among traders who prefer to use adaptive indicators to identify trends and potential reversals.
Adaptive Moving Average
The Adaptive Moving Average (AMA) is a type of moving average that adjusts its sensitivity to price movements based on market conditions. It uses a ratio between the current price and the highest and lowest prices over a certain lookback period to determine its level of smoothing. The AMA can help reduce lag and increase responsiveness to changes in trend direction, making it useful for traders who want to follow trends while avoiding false signals. The AMA is calculated by multiplying a smoothing constant with the difference between the current price and the previous AMA value, then adding the result to the previous AMA value.
T3
The T3 moving average is a type of technical indicator used in financial analysis to identify trends in price movements. It is similar to the Exponential Moving Average (EMA) and the Double Exponential Moving Average (DEMA), but uses a different smoothing algorithm.
The T3 moving average is calculated using a series of exponential moving averages that are designed to filter out noise and smooth the data. The resulting smoothed data is then weighted with a non-linear function to produce a final output that is more responsive to changes in trend direction.
The T3 moving average can be customized by adjusting the length of the moving average, as well as the weighting function used to smooth the data. It is commonly used in conjunction with other technical indicators as part of a larger trading strategy.
█ Giga Kaleidoscope Modularized Trading System
Core components of an NNFX algorithmic trading strategy
The NNFX algorithm is built on the principles of trend, momentum, and volatility. There are six core components in the NNFX trading algorithm:
1. Volatility - price volatility; e.g., Average True Range, True Range Double, Close-to-Close, etc.
2. Baseline - a moving average to identify price trend
3. Confirmation 1 - a technical indicator used to identify trends
4. Confirmation 2 - a technical indicator used to identify trends
5. Continuation - a technical indicator used to identify trends
6. Volatility/Volume - a technical indicator used to identify volatility/volume breakouts/breakdown
7. Exit - a technical indicator used to determine when a trend is exhausted
What is Volatility in the NNFX trading system?
In the NNFX (No Nonsense Forex) trading system, ATR (Average True Range) is typically used to measure the volatility of an asset. It is used as a part of the system to help determine the appropriate stop loss and take profit levels for a trade. ATR is calculated by taking the average of the true range values over a specified period.
True range is calculated as the maximum of the following values:
-Current high minus the current low
-Absolute value of the current high minus the previous close
-Absolute value of the current low minus the previous close
ATR is a dynamic indicator that changes with changes in volatility. As volatility increases, the value of ATR increases, and as volatility decreases, the value of ATR decreases. By using ATR in NNFX system, traders can adjust their stop loss and take profit levels according to the volatility of the asset being traded. This helps to ensure that the trade is given enough room to move, while also minimizing potential losses.
Other types of volatility include True Range Double (TRD), Close-to-Close, and Garman-Klass
What is a Baseline indicator?
The baseline is essentially a moving average, and is used to determine the overall direction of the market.
The baseline in the NNFX system is used to filter out trades that are not in line with the long-term trend of the market. The baseline is plotted on the chart along with other indicators, such as the Moving Average (MA), the Relative Strength Index (RSI), and the Average True Range (ATR).
Trades are only taken when the price is in the same direction as the baseline. For example, if the baseline is sloping upwards, only long trades are taken, and if the baseline is sloping downwards, only short trades are taken. This approach helps to ensure that trades are in line with the overall trend of the market, and reduces the risk of entering trades that are likely to fail.
By using a baseline in the NNFX system, traders can have a clear reference point for determining the overall trend of the market, and can make more informed trading decisions. The baseline helps to filter out noise and false signals, and ensures that trades are taken in the direction of the long-term trend.
What is a Confirmation indicator?
Confirmation indicators are technical indicators that are used to confirm the signals generated by primary indicators. Primary indicators are the core indicators used in the NNFX system, such as the Average True Range (ATR), the Moving Average (MA), and the Relative Strength Index (RSI).
The purpose of the confirmation indicators is to reduce false signals and improve the accuracy of the trading system. They are designed to confirm the signals generated by the primary indicators by providing additional information about the strength and direction of the trend.
Some examples of confirmation indicators that may be used in the NNFX system include the Bollinger Bands, the MACD (Moving Average Convergence Divergence), and the MACD Oscillator. These indicators can provide information about the volatility, momentum, and trend strength of the market, and can be used to confirm the signals generated by the primary indicators.
In the NNFX system, confirmation indicators are used in combination with primary indicators and other filters to create a trading system that is robust and reliable. By using multiple indicators to confirm trading signals, the system aims to reduce the risk of false signals and improve the overall profitability of the trades.
What is a Continuation indicator?
In the NNFX (No Nonsense Forex) trading system, a continuation indicator is a technical indicator that is used to confirm a current trend and predict that the trend is likely to continue in the same direction. A continuation indicator is typically used in conjunction with other indicators in the system, such as a baseline indicator, to provide a comprehensive trading strategy.
What is a Volatility/Volume indicator?
Volume indicators, such as the On Balance Volume (OBV), the Chaikin Money Flow (CMF), or the Volume Price Trend (VPT), are used to measure the amount of buying and selling activity in a market. They are based on the trading volume of the market, and can provide information about the strength of the trend. In the NNFX system, volume indicators are used to confirm trading signals generated by the Moving Average and the Relative Strength Index. Volatility indicators include Average Direction Index, Waddah Attar, and Volatility Ratio. In the NNFX trading system, volatility is a proxy for volume and vice versa.
By using volume indicators as confirmation tools, the NNFX trading system aims to reduce the risk of false signals and improve the overall profitability of trades. These indicators can provide additional information about the market that is not captured by the primary indicators, and can help traders to make more informed trading decisions. In addition, volume indicators can be used to identify potential changes in market trends and to confirm the strength of price movements.
What is an Exit indicator?
The exit indicator is used in conjunction with other indicators in the system, such as the Moving Average (MA), the Relative Strength Index (RSI), and the Average True Range (ATR), to provide a comprehensive trading strategy.
The exit indicator in the NNFX system can be any technical indicator that is deemed effective at identifying optimal exit points. Examples of exit indicators that are commonly used include the Parabolic SAR, the Average Directional Index (ADX), and the Chandelier Exit.
The purpose of the exit indicator is to identify when a trend is likely to reverse or when the market conditions have changed, signaling the need to exit a trade. By using an exit indicator, traders can manage their risk and prevent significant losses.
In the NNFX system, the exit indicator is used in conjunction with a stop loss and a take profit order to maximize profits and minimize losses. The stop loss order is used to limit the amount of loss that can be incurred if the trade goes against the trader, while the take profit order is used to lock in profits when the trade is moving in the trader's favor.
Overall, the use of an exit indicator in the NNFX trading system is an important component of a comprehensive trading strategy. It allows traders to manage their risk effectively and improve the profitability of their trades by exiting at the right time.
How does Loxx's GKD (Giga Kaleidoscope Modularized Trading System) implement the NNFX algorithm outlined above?
Loxx's GKD v1.0 system has five types of modules (indicators/strategies). These modules are:
1. GKD-BT - Backtesting module (Volatility, Number 1 in the NNFX algorithm)
2. GKD-B - Baseline module (Baseline and Volatility/Volume, Numbers 1 and 2 in the NNFX algorithm)
3. GKD-C - Confirmation 1/2 and Continuation module (Confirmation 1/2 and Continuation, Numbers 3, 4, and 5 in the NNFX algorithm)
4. GKD-V - Volatility/Volume module (Confirmation 1/2, Number 6 in the NNFX algorithm)
5. GKD-E - Exit module (Exit, Number 7 in the NNFX algorithm)
(additional module types will added in future releases)
Each module interacts with every module by passing data between modules. Data is passed between each module as described below:
GKD-B => GKD-V => GKD-C(1) => GKD-C(2) => GKD-C(Continuation) => GKD-E => GKD-BT
That is, the Baseline indicator passes its data to Volatility/Volume. The Volatility/Volume indicator passes its values to the Confirmation 1 indicator. The Confirmation 1 indicator passes its values to the Confirmation 2 indicator. The Confirmation 2 indicator passes its values to the Continuation indicator. The Continuation indicator passes its values to the Exit indicator, and finally, the Exit indicator passes its values to the Backtest strategy.
This chaining of indicators requires that each module conform to Loxx's GKD protocol, therefore allowing for the testing of every possible combination of technical indicators that make up the six components of the NNFX algorithm.
What does the application of the GKD trading system look like?
Example trading system:
Backtest: Strategy with 1-3 take profits, trailing stop loss, multiple types of PnL volatility, and 2 backtesting styles
Baseline: Hull Moving Average
Volatility/Volume: Cercos Chaos vs Movement as shown on the chart above
Confirmation 1: Fisher Transform
Confirmation 2: Williams Percent Range
Continuation: Cercos Chaos vs Movement
Exit: Rex Oscillator
Each GKD indicator is denoted with a module identifier of either: GKD-BT, GKD-B, GKD-C, GKD-V, or GKD-E. This allows traders to understand to which module each indicator belongs and where each indicator fits into the GKD protocol chain.
Giga Kaleidoscope Modularized Trading System Signals (based on the NNFX algorithm)
Standard Entry
1. GKD-C Confirmation 1 Signal
2. GKD-B Baseline agrees
3. Price is within a range of 0.2x Volatility and 1.0x Volatility of the Goldie Locks Mean
4. GKD-C Confirmation 2 agrees
5. GKD-V Volatility/Volume agrees
Baseline Entry
1. GKD-B Baseline signal
2. GKD-C Confirmation 1 agrees
3. Price is within a range of 0.2x Volatility and 1.0x Volatility of the Goldie Locks Mean
4. GKD-C Confirmation 2 agrees
5. GKD-V Volatility/Volume agrees
6. GKD-C Confirmation 1 signal was less than 7 candles prior
Volatility/Volume Entry
1. GKD-V Volatility/Volume signal
2. GKD-C Confirmation 1 agrees
3. Price is within a range of 0.2x Volatility and 1.0x Volatility of the Goldie Locks Mean
4. GKD-C Confirmation 2 agrees
5. GKD-B Baseline agrees
6. GKD-C Confirmation 1 signal was less than 7 candles prior
Continuation Entry
1. Standard Entry, Baseline Entry, or Pullback; entry triggered previously
2. GKD-B Baseline hasn't crossed since entry signal trigger
3. GKD-C Confirmation Continuation Indicator signals
4. GKD-C Confirmation 1 agrees
5. GKD-B Baseline agrees
6. GKD-C Confirmation 2 agrees
1-Candle Rule Standard Entry
1. GKD-C Confirmation 1 signal
2. GKD-B Baseline agrees
3. Price is within a range of 0.2x Volatility and 1.0x Volatility of the Goldie Locks Mean
Next Candle:
1. Price retraced (Long: close < close or Short: close > close )
2. GKD-B Baseline agrees
3. GKD-C Confirmation 1 agrees
4. GKD-C Confirmation 2 agrees
5. GKD-V Volatility/Volume agrees
1-Candle Rule Baseline Entry
1. GKD-B Baseline signal
2. GKD-C Confirmation 1 agrees
3. Price is within a range of 0.2x Volatility and 1.0x Volatility of the Goldie Locks Mean
4. GKD-C Confirmation 1 signal was less than 7 candles prior
Next Candle:
1. Price retraced (Long: close < close or Short: close > close )
2. GKD-B Baseline agrees
3. GKD-C Confirmation 1 agrees
4. GKD-C Confirmation 2 agrees
5. GKD-V Volatility/Volume Agrees
1-Candle Rule Volatility/Volume Entry
1. GKD-V Volatility/Volume signal
2. GKD-C Confirmation 1 agrees
3. Price is within a range of 0.2x Volatility and 1.0x Volatility of the Goldie Locks Mean
4. GKD-C Confirmation 1 signal was less than 7 candles prior
Next Candle:
1. Price retraced (Long: close < close or Short: close > close)
2. GKD-B Volatility/Volume agrees
3. GKD-C Confirmation 1 agrees
4. GKD-C Confirmation 2 agrees
5. GKD-B Baseline agrees
PullBack Entry
1. GKD-B Baseline signal
2. GKD-C Confirmation 1 agrees
3. Price is beyond 1.0x Volatility of Baseline
Next Candle:
1. Price is within a range of 0.2x Volatility and 1.0x Volatility of the Goldie Locks Mean
2. GKD-C Confirmation 1 agrees
3. GKD-C Confirmation 2 agrees
4. GKD-V Volatility/Volume Agrees
]█ Setting up the GKD
The GKD system involves chaining indicators together. These are the steps to set this up.
Use a GKD-C indicator alone on a chart
1. Inside the GKD-C indicator, change the "Confirmation Type" setting to "Solo Confirmation Simple"
Use a GKD-V indicator alone on a chart
**nothing, it's already useable on the chart without any settings changes
Use a GKD-B indicator alone on a chart
**nothing, it's already useable on the chart without any settings changes
Baseline (Baseline, Backtest)
1. Import the GKD-B Baseline into the GKD-BT Backtest: "Input into Volatility/Volume or Backtest (Baseline testing)"
2. Inside the GKD-BT Backtest, change the setting "Backtest Special" to "Baseline"
Volatility/Volume (Volatility/Volume, Backte st)
1. Inside the GKD-V indicator, change the "Testing Type" setting to "Solo"
2. Inside the GKD-V indicator, change the "Signal Type" setting to "Crossing" (neither traditional nor both can be backtested)
3. Import the GKD-V indicator into the GKD-BT Backtest: "Input into C1 or Backtest"
4. Inside the GKD-BT Backtest, change the setting "Backtest Special" to "Volatility/Volume"
5. Inside the GKD-BT Backtest, a) change the setting "Backtest Type" to "Trading" if using a directional GKD-V indicator; or, b) change the setting "Backtest Type" to "Full" if using a directional or non-directional GKD-V indicator (non-directional GKD-V can only test Longs and Shorts separately)
6. If "Backtest Type" is set to "Full": Inside the GKD-BT Backtest, change the setting "Backtest Side" to "Long" or "Short
7. If "Backtest Type" is set to "Full": To allow the system to open multiple orders at one time so you test all Longs or Shorts, open the GKD-BT Backtest, click the tab "Properties" and then insert a value of something like 10 orders into the "Pyramiding" settings. This will allow 10 orders to be opened at one time which should be enough to catch all possible Longs or Shorts.
Solo Confirmation Simple (Confirmation, Backtest)
1. Inside the GKD-C indicator, change the "Confirmation Type" setting to "Solo Confirmation Simple"
1. Import the GKD-C indicator into the GKD-BT Backtest: "Input into Backtest"
2. Inside the GKD-BT Backtest, change the setting "Backtest Special" to "Solo Confirmation Simple"
Solo Confirmation Complex without Exits (Baseline, Volatility/Volume, Confirmation, Backtest)
1. Inside the GKD-V indicator, change the "Testing Type" setting to "Chained"
2. Import the GKD-B Baseline into the GKD-V indicator: "Input into Volatility/Volume or Backtest (Baseline testing)"
3. Inside the GKD-C indicator, change the "Confirmation Type" setting to "Solo Confirmation Complex"
4. Import the GKD-V indicator into the GKD-C indicator: "Input into C1 or Backtest"
5. Inside the GKD-BT Backtest, change the setting "Backtest Special" to "GKD Full wo/ Exits"
6. Import the GKD-C into the GKD-BT Backtest: "Input into Exit or Backtest"
Solo Confirmation Complex with Exits (Baseline, Volatility/Volume, Confirmation, Exit, Backtest)
1. Inside the GKD-V indicator, change the "Testing Type" setting to "Chained"
2. Import the GKD-B Baseline into the GKD-V indicator: "Input into Volatility/Volume or Backtest (Baseline testing)"
3. Inside the GKD-C indicator, change the "Confirmation Type" setting to "Solo Confirmation Complex"
4. Import the GKD-V indicator into the GKD-C indicator: "Input into C1 or Backtest"
5. Import the GKD-C indicator into the GKD-E indicator: "Input into Exit"
6. Inside the GKD-BT Backtest, change the setting "Backtest Special" to "GKD Full w/ Exits"
7. Import the GKD-E into the GKD-BT Backtest: "Input into Backtest"
Full GKD without Exits (Baseline, Volatility/Volume, Confirmation 1, Confirmation 2, Continuation, Backtest)
1. Inside the GKD-V indicator, change the "Testing Type" setting to "Chained"
2. Import the GKD-B Baseline into the GKD-V indicator: "Input into Volatility/Volume or Backtest (Baseline testing)"
3. Inside the GKD-C 1 indicator, change the "Confirmation Type" setting to "Confirmation 1"
4. Import the GKD-V indicator into the GKD-C 1 indicator: "Input into C1 or Backtest"
5. Inside the GKD-C 2 indicator, change the "Confirmation Type" setting to "Confirmation 2"
6. Import the GKD-C 1 indicator into the GKD-C 2 indicator: "Input into C2"
7. Inside the GKD-C Continuation indicator, change the "Confirmation Type" setting to "Continuation"
8. Inside the GKD-BT Backtest, change the setting "Backtest Special" to "GKD Full wo/ Exits"
9. Import the GKD-E into the GKD-BT Backtest: "Input into Exit or Backtest"
Full GKD with Exits (Baseline, Volatility/Volume, Confirmation 1, Confirmation 2, Continuation, Exit, Backtest)
1. Inside the GKD-V indicator, change the "Testing Type" setting to "Chained"
2. Import the GKD-B Baseline into the GKD-V indicator: "Input into Volatility/Volume or Backtest (Baseline testing)"
3. Inside the GKD-C 1 indicator, change the "Confirmation Type" setting to "Confirmation 1"
4. Import the GKD-V indicator into the GKD-C 1 indicator: "Input into C1 or Backtest"
5. Inside the GKD-C 2 indicator, change the "Confirmation Type" setting to "Confirmation 2"
6. Import the GKD-C 1 indicator into the GKD-C 2 indicator: "Input into C2"
7. Inside the GKD-C Continuation indicator, change the "Confirmation Type" setting to "Continuation"
8. Import the GKD-C Continuation indicator into the GKD-E indicator: "Input into Exit"
9. Inside the GKD-BT Backtest, change the setting "Backtest Special" to "GKD Full w/ Exits"
10. Import the GKD-E into the GKD-BT Backtest: "Input into Backtest"
Baseline + Volatility/Volume (Baseline, Volatility/Volume, Backtest)
1. Inside the GKD-V indicator, change the "Testing Type" setting to "Baseline + Volatility/Volume"
2. Inside the GKD-V indicator, make sure the "Signal Type" setting is set to "Traditional"
3. Import the GKD-B Baseline into the GKD-V indicator: "Input into Volatility/Volume or Backtest (Baseline testing)"
4. Inside the GKD-BT Backtest, change the setting "Backtest Special" to "Baseline + Volatility/Volume"
5. Import the GKD-V into the GKD-BT Backtest: "Input into C1 or Backtest"
6. Inside the GKD-BT Backtest, change the setting "Backtest Type" to "Full". For this backtest, you must test Longs and Shorts separately
7. To allow the system to open multiple orders at one time so you can test all Longs or Shorts, open the GKD-BT Backtest, click the tab "Properties" and then insert a value of something like 10 orders into the "Pyramiding" settings. This will allow 10 orders to be opened at one time which should be enough to catch all possible Longs or Shorts.
Requirements
Inputs
Chained: GKD-B Baseline
Solo: NA, no inputs
Baseline + Volatility/Volume: GKD-B Baseline
Outputs
Chained: GKD-C indicators Confirmation 1 or Solo Confirmation Complex
Solo: GKD-BT Backtest
Baseline + Volatility/Volume: GKD-BT Backtest
Additional features will be added in future releases.

GKD-C T3 Velocity [Loxx]Giga Kaleidoscope GKD-C T3 Velocity is a Confirmation module included in Loxx's "Giga Kaleidoscope Modularized Trading System".
█ Giga Kaleidoscope Modularized Trading System
What is Loxx's "Giga Kaleidoscope Modularized Trading System"?
The Giga Kaleidoscope Modularized Trading System is a trading system built on the philosophy of the NNFX (No Nonsense Forex) algorithmic trading.
What is the NNFX algorithmic trading strategy?
The NNFX (No-Nonsense Forex) trading system is a comprehensive approach to Forex trading that is designed to simplify the process and remove the confusion and complexity that often surrounds trading. The system was developed by a Forex trader who goes by the pseudonym "VP" and has gained a significant following in the Forex community.
The NNFX trading system is based on a set of rules and guidelines that help traders make objective and informed decisions. These rules cover all aspects of trading, including market analysis, trade entry, stop loss placement, and trade management.
Here are the main components of the NNFX trading system:
1. Trading Philosophy: The NNFX trading system is based on the idea that successful trading requires a comprehensive understanding of the market, objective analysis, and strict risk management. The system aims to remove subjective elements from trading and focuses on objective rules and guidelines.
2. Technical Analysis: The NNFX trading system relies heavily on technical analysis and uses a range of indicators to identify high-probability trading opportunities. The system uses a combination of trend-following and mean-reverting strategies to identify trades.
3. Market Structure: The NNFX trading system emphasizes the importance of understanding the market structure, including price action, support and resistance levels, and market cycles. The system uses a range of tools to identify the market structure, including trend lines, channels, and moving averages.
4. Trade Entry: The NNFX trading system has strict rules for trade entry. The system uses a combination of technical indicators to identify high-probability trades, and traders must meet specific criteria to enter a trade.
5. Stop Loss Placement: The NNFX trading system places a significant emphasis on risk management and requires traders to place a stop loss order on every trade. The system uses a combination of technical analysis and market structure to determine the appropriate stop loss level.
6. Trade Management: The NNFX trading system has specific rules for managing open trades. The system aims to minimize risk and maximize profit by using a combination of trailing stops, take profit levels, and position sizing.
Overall, the NNFX trading system is designed to be a straightforward and easy-to-follow approach to Forex trading that can be applied by traders of all skill levels.
Core components of an NNFX algorithmic trading strategy
The NNFX algorithm is built on the principles of trend, momentum, and volatility. There are six core components in the NNFX trading algorithm:
1. Volatility - price volatility; e.g., Average True Range, True Range Double, Close-to-Close, etc.
2. Baseline - a moving average to identify price trend
3. Confirmation 1 - a technical indicator used to identify trends
4. Confirmation 2 - a technical indicator used to identify trends
5. Continuation - a technical indicator used to identify trends
6. Volatility/Volume - a technical indicator used to identify volatility/volume breakouts/breakdown
7. Exit - a technical indicator used to determine when a trend is exhausted
What is Volatility in the NNFX trading system?
In the NNFX (No Nonsense Forex) trading system, ATR (Average True Range) is typically used to measure the volatility of an asset. It is used as a part of the system to help determine the appropriate stop loss and take profit levels for a trade. ATR is calculated by taking the average of the true range values over a specified period.
True range is calculated as the maximum of the following values:
-Current high minus the current low
-Absolute value of the current high minus the previous close
-Absolute value of the current low minus the previous close
ATR is a dynamic indicator that changes with changes in volatility. As volatility increases, the value of ATR increases, and as volatility decreases, the value of ATR decreases. By using ATR in NNFX system, traders can adjust their stop loss and take profit levels according to the volatility of the asset being traded. This helps to ensure that the trade is given enough room to move, while also minimizing potential losses.
Other types of volatility include True Range Double (TRD), Close-to-Close, and Garman-Klass
What is a Baseline indicator?
The baseline is essentially a moving average, and is used to determine the overall direction of the market.
The baseline in the NNFX system is used to filter out trades that are not in line with the long-term trend of the market. The baseline is plotted on the chart along with other indicators, such as the Moving Average (MA), the Relative Strength Index (RSI), and the Average True Range (ATR).
Trades are only taken when the price is in the same direction as the baseline. For example, if the baseline is sloping upwards, only long trades are taken, and if the baseline is sloping downwards, only short trades are taken. This approach helps to ensure that trades are in line with the overall trend of the market, and reduces the risk of entering trades that are likely to fail.
By using a baseline in the NNFX system, traders can have a clear reference point for determining the overall trend of the market, and can make more informed trading decisions. The baseline helps to filter out noise and false signals, and ensures that trades are taken in the direction of the long-term trend.
What is a Confirmation indicator?
Confirmation indicators are technical indicators that are used to confirm the signals generated by primary indicators. Primary indicators are the core indicators used in the NNFX system, such as the Average True Range (ATR), the Moving Average (MA), and the Relative Strength Index (RSI).
The purpose of the confirmation indicators is to reduce false signals and improve the accuracy of the trading system. They are designed to confirm the signals generated by the primary indicators by providing additional information about the strength and direction of the trend.
Some examples of confirmation indicators that may be used in the NNFX system include the Bollinger Bands, the MACD (Moving Average Convergence Divergence), and the Stochastic Oscillator. These indicators can provide information about the volatility, momentum, and trend strength of the market, and can be used to confirm the signals generated by the primary indicators.
In the NNFX system, confirmation indicators are used in combination with primary indicators and other filters to create a trading system that is robust and reliable. By using multiple indicators to confirm trading signals, the system aims to reduce the risk of false signals and improve the overall profitability of the trades.
What is a Continuation indicator?
In the NNFX (No Nonsense Forex) trading system, a continuation indicator is a technical indicator that is used to confirm a current trend and predict that the trend is likely to continue in the same direction. A continuation indicator is typically used in conjunction with other indicators in the system, such as a baseline indicator, to provide a comprehensive trading strategy.
What is a Volatility/Volume indicator?
Volume indicators, such as the On Balance Volume (OBV), the Chaikin Money Flow (CMF), or the Volume Price Trend (VPT), are used to measure the amount of buying and selling activity in a market. They are based on the trading volume of the market, and can provide information about the strength of the trend. In the NNFX system, volume indicators are used to confirm trading signals generated by the Moving Average and the Relative Strength Index. Volatility indicators include Average Direction Index, Waddah Attar, and Volatility Ratio. In the NNFX trading system, volatility is a proxy for volume and vice versa.
By using volume indicators as confirmation tools, the NNFX trading system aims to reduce the risk of false signals and improve the overall profitability of trades. These indicators can provide additional information about the market that is not captured by the primary indicators, and can help traders to make more informed trading decisions. In addition, volume indicators can be used to identify potential changes in market trends and to confirm the strength of price movements.
What is an Exit indicator?
The exit indicator is used in conjunction with other indicators in the system, such as the Moving Average (MA), the Relative Strength Index (RSI), and the Average True Range (ATR), to provide a comprehensive trading strategy.
The exit indicator in the NNFX system can be any technical indicator that is deemed effective at identifying optimal exit points. Examples of exit indicators that are commonly used include the Parabolic SAR, the Average Directional Index (ADX), and the Chandelier Exit.
The purpose of the exit indicator is to identify when a trend is likely to reverse or when the market conditions have changed, signaling the need to exit a trade. By using an exit indicator, traders can manage their risk and prevent significant losses.
In the NNFX system, the exit indicator is used in conjunction with a stop loss and a take profit order to maximize profits and minimize losses. The stop loss order is used to limit the amount of loss that can be incurred if the trade goes against the trader, while the take profit order is used to lock in profits when the trade is moving in the trader's favor.
Overall, the use of an exit indicator in the NNFX trading system is an important component of a comprehensive trading strategy. It allows traders to manage their risk effectively and improve the profitability of their trades by exiting at the right time.
How does Loxx's GKD (Giga Kaleidoscope Modularized Trading System) implement the NNFX algorithm outlined above?
Loxx's GKD v1.0 system has five types of modules (indicators/strategies). These modules are:
1. GKD-BT - Backtesting module (Volatility, Number 1 in the NNFX algorithm)
2. GKD-B - Baseline module (Baseline and Volatility/Volume, Numbers 1 and 2 in the NNFX algorithm)
3. GKD-C - Confirmation 1/2 and Continuation module (Confirmation 1/2 and Continuation, Numbers 3, 4, and 5 in the NNFX algorithm)
4. GKD-V - Volatility/Volume module (Confirmation 1/2, Number 6 in the NNFX algorithm)
5. GKD-E - Exit module (Exit, Number 7 in the NNFX algorithm)
(additional module types will added in future releases)
Each module interacts with every module by passing data between modules. Data is passed between each module as described below:
GKD-B => GKD-V => GKD-C(1) => GKD-C(2) => GKD-C(Continuation) => GKD-E => GKD-BT
That is, the Baseline indicator passes its data to Volatility/Volume. The Volatility/Volume indicator passes its values to the Confirmation 1 indicator. The Confirmation 1 indicator passes its values to the Confirmation 2 indicator. The Confirmation 2 indicator passes its values to the Continuation indicator. The Continuation indicator passes its values to the Exit indicator, and finally, the Exit indicator passes its values to the Backtest strategy.
This chaining of indicators requires that each module conform to Loxx's GKD protocol, therefore allowing for the testing of every possible combination of technical indicators that make up the six components of the NNFX algorithm.
What does the application of the GKD trading system look like?
Example trading system:
Backtest: Strategy with 1-3 take profits, trailing stop loss, multiple types of PnL volatility, and 2 backtesting styles
Baseline: Hull Moving Average
Volatility/Volume: Volatility Ratio
Confirmation 1: GKD-V T3 Velocity as shown on the chart above
Confirmation 2: Williams Percent Range
Continuation: Fisher Transform
Exit: Rex Oscillator
Each GKD indicator is denoted with a module identifier of either: GKD-BT, GKD-B, GKD-C, GKD-V, or GKD-E. This allows traders to understand to which module each indicator belongs and where each indicator fits into the GKD protocol chain.
Giga Kaleidoscope Modularized Trading System Signals (based on the NNFX algorithm)
Standard Entry
1. GKD-C Confirmation 1 Signal
2. GKD-B Baseline agrees
3. Price is within a range of 0.2x Volatility and 1.0x Volatility of the Goldie Locks Mean
4. GKD-C Confirmation 2 agrees
5. GKD-V Volatility/Volume agrees
Baseline Entry
1. GKD-B Baseline signal
2. GKD-C Confirmation 1 agrees
3. Price is within a range of 0.2x Volatility and 1.0x Volatility of the Goldie Locks Mean
4. GKD-C Confirmation 2 agrees
5. GKD-V Volatility/Volume agrees
6. GKD-C Confirmation 1 signal was less than 7 candles prior
Continuation Entry
1. Standard Entry, Baseline Entry, or Pullback; entry triggered previously
2. GKD-B Baseline hasn't crossed since entry signal trigger
3. GKD-C Confirmation Continuation Indicator signals
4. GKD-C Confirmation 1 agrees
5. GKD-B Baseline agrees
6. GKD-C Confirmation 2 agrees
1-Candle Rule Standard Entry
1. GKD-C Confirmation 1 signal
2. GKD-B Baseline agrees
3. Price is within a range of 0.2x Volatility and 1.0x Volatility of the Goldie Locks Mean
Next Candle:
1. Price retraced (Long: close < close or Short: close > close )
2. GKD-B Baseline agrees
3. GKD-C Confirmation 1 agrees
4. GKD-C Confirmation 2 agrees
5. GKD-V Volatility/Volume agrees
1-Candle Rule Baseline Entry
1. GKD-B Baseline signal
2. GKD-C Confirmation 1 agrees
3. Price is within a range of 0.2x Volatility and 1.0x Volatility of the Goldie Locks Mean
4. GKD-C Confirmation 1 signal was less than 7 candles prior
Next Candle:
1. Price retraced (Long: close < close or Short: close > close )
2. GKD-B Baseline agrees
3. GKD-C Confirmation 1 agrees
4. GKD-C Confirmation 2 agrees
5. GKD-V Volatility/Volume Agrees
PullBack Entry
1. GKD-B Baseline signal
2. GKD-C Confirmation 1 agrees
3. Price is beyond 1.0x Volatility of Baseline
Next Candle:
1. Price is within a range of 0.2x Volatility and 1.0x Volatility of the Goldie Locks Mean
3. GKD-C Confirmation 1 agrees
4. GKD-C Confirmation 2 agrees
5. GKD-V Volatility/Volume Agrees
█ GKD-V T3 Velocity
What is T3?
The T3 Moving Average (T3MA) is a technical analysis indicator that was developed by Tim Tillson. It is a trend-following indicator that aims to provide a smoother and more accurate representation of price trends than other moving average indicators.
The T3MA is a type of exponential moving average (EMA) that is calculated using a series of complex formulas. Unlike a simple or exponential moving average, which use fixed smoothing factors, the T3MA uses a variable smoothing factor that is based on the volatility of the underlying asset. This means that the T3MA is able to adapt to changing market conditions and provide more accurate signals.
The formula for calculating the T3MA is as follows:
T3 = a * EMA1 + (1 - a) * T3
Where:
-T3 is the current value of the T3MA
-EMA1 is the current value of the first EMA
-T3 is the previous value of the T3MA
-a is the smoothing factor, which is based on the volatility of the underlying asset and is calculated using the following formulas:
-c1 = -1 + exp(-sqrt(2) * pi / period)
-c2 = 2 * c1 * c1 + 2 * c1
-c3 = 1 - c1 - c2
-a = c1 * sqrt(period) * (close - T3 ) + c2 * T3 + c3 * EMA1
In simple terms, the T3MA is calculated by taking a weighted average of two different EMAs, with the weight given to each EMA depending on the volatility of the asset being analyzed. The T3MA is then smoothed using a second smoothing factor, which further reduces noise and improves the accuracy of the indicator.
The T3MA can be used in a variety of ways by traders and analysts. Some common applications include using the T3MA as a trend-following indicator, with buy signals generated when the price of an asset crosses above the T3MA and sell signals generated when the price crosses below. The T3MA can also be used in combination with other indicators and analytical techniques to confirm trading decisions and identify potential trend reversals.
Overall, the T3 Moving Average is a highly sophisticated and complex technical indicator that is designed to provide a more accurate and reliable representation of price trends. While it may be difficult for novice traders to understand and use effectively, experienced traders and analysts may find the T3MA to be a valuable tool in their trading toolbox.
What is Velocity?
Velocity can have different meanings depending on the context. Here are a few definitions:
In physics, velocity is a measure of the rate and direction of motion of an object. It is typically expressed in meters per second (m/s) or another unit of distance divided by time.
In finance and economics, velocity refers to the speed at which money circulates in an economy. It is usually measured as the ratio of gross domestic product (GDP) to the money supply.
In trading, velocity can refer to the speed and magnitude of price movements. It can be used as an indicator of momentum or trend strength.
What is T3 Velocity?
T3 Velocity is a better performing MACD that uses different hot (alpha) values for the slow and fast period inputs.
Requirements
Inputs
Confirmation 1 and Solo Confirmation: GKD-V Volatility / Volume indicator
Confirmation 2: GKD-C Confirmation indicator
Outputs
Confirmation 2 and Solo Confirmation Complex: GKD-E Exit indicator
Confirmation 1: GKD-C Confirmation indicator
Continuation: GKD-E Exit indicator
Solo Confirmation Simple: GKD-BT Backtest strategy
Additional features will be added in future releases.
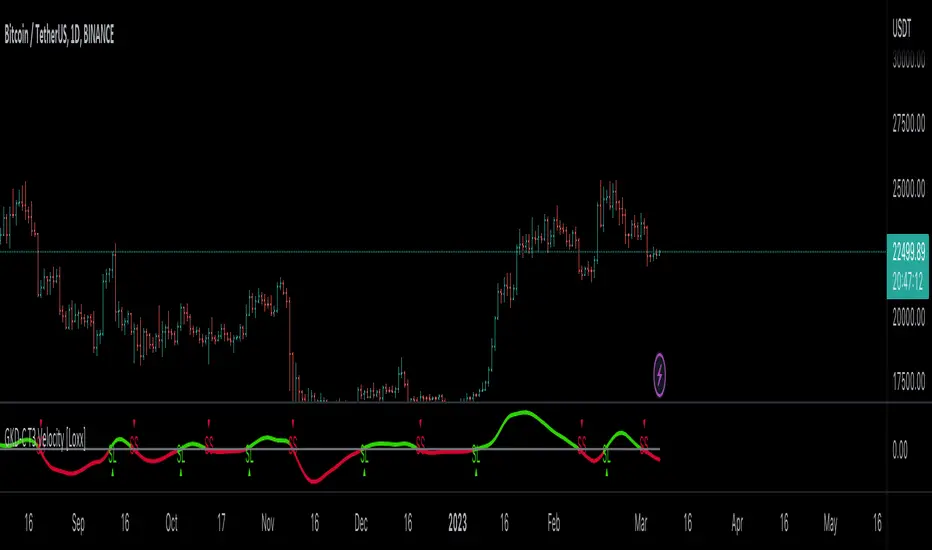
RAS.V2 Strength Index OscillatorHeavily modified version of my previous "Relative Aggregate Strength Oscillator" -Added high/low lines, alma curves,, lrc bands, changed candle calculations + other small things. Replaces the standard RSI indicator with something a bit more insightful.
Credits to @wolneyyy - 'Mean Deviation Detector - Throw Out All Other Indicators ' And @algomojo - 'Responsive Coppock Curve'
And the default Relative Strength Index
The candles are the average of the MFI ,CCI ,MOM and RSI candles, they seemed similar enough in style to me so I created candles out of each and the took the sum of all the candle's OHLC values and divided by 4 to get an average, same as v1 but with some tweaks. Previous Peaks and Potholes visible with the blue horizontal lines which adjust when a new boundary is established. Toggle alma waves or smalrc curves or both to your liking. This indicator is great for calling out peaks and troughs in realtime, although is best when combined with other trusted indicators to get a consensus.

Currency Strength v3.0Currency Strength v3.0
Summary
The Currency Strength indicator is a powerful tool designed to gauge the relative strength of major and emerging market currencies. By plotting the True Strength Index (TSI) of various currency indices, it provides a clear visual representation of which currencies are gaining momentum and which are losing it. This indicator automatically detects the currency pair on your chart and highlights the corresponding strength lines, simplifying analysis and helping you quickly identify potential trading opportunities based on currency dynamics.
Key Features
Comprehensive Currency Analysis: Tracks the strength of 19 currencies, including major pairs and several emerging market currencies.
Automatic Pair Detection: Intelligently identifies the base and quote currency of the active chart, automatically highlighting the relevant strength lines.
Dynamic Coloring: The base currency is consistently colored blue, and the quote currency is colored gold, making it easy to distinguish between the two at a glance.
Non-Repainting TSI Calculation: Uses the True Strength Index (TSI) for smooth and reliable momentum readings that do not repaint.
Customizable Settings: Allows for adjustment of the fast and slow periods for the TSI calculation to fit your specific trading style.
Clean Interface: Features a minimalist legend table that only displays the currencies relevant to your current chart, keeping your workspace uncluttered.
How It Works
The indicator pulls data from major currency indices (like DXY for the US Dollar and EXY for the Euro). For currencies that don't have a dedicated index, it uses their USD pair (e.g., USDCNY) and inverts the calculation to derive the currency's strength relative to the dollar. It then applies the True Strength Index (TSI) to this data. The TSI is a momentum oscillator that is less volatile than other oscillators, providing a more reliable measure of strength. The resulting values are plotted on the chart, allowing you to see how different currencies are performing against each other in real-time.
How to Use
Trend Confirmation: When the base currency's line is rising and above the zero line, and the quote currency's line is falling, it can confirm a bullish trend for the pair. The opposite would suggest a bearish trend.
Identifying Divergences: Look for divergences between the currency strength lines and the price action of the pair. For example, if the price is making higher highs but the base currency's strength is making lower highs, it could signal a potential reversal.
Crossovers: A crossover of the base and quote currency lines can signal a shift in momentum. A bullish signal occurs when the base currency line crosses above the quote currency line. A bearish signal occurs when it crosses below.
Overbought/Oversold Levels: The horizontal dashed lines at 0.5 and -0.5 can be used as general guides for overbought and oversold conditions, respectively. Strength moving beyond these levels may indicate an unsustainable move that is due for a correction.
Settings
Fast Period: The short-term period for the TSI calculation. Default is 7.
Slow Period: The long-term period for the TSI calculation. Default is 15.
Index Source: The price source used for the calculations (e.g., Close, Open). Default is Close.
Base Currency Color: The color for the base currency line. Default is Royal Blue.
Quote Currency Color: The color for the quote currency line. Default is Goldenrod.
Disclaimer
This indicator is intended for educational and analytical purposes only. It is not financial advice. Trading involves substantial risk, and past performance is not indicative of future results. Always conduct your own research and risk management before making any trading decisions.

Crypto Risk-Weighted Allocation SuiteCrypto Risk-Weighted Allocation Suite
This indicator is designed to help users explore dynamic portfolio allocation frameworks for the crypto market. It calculates risk-adjusted allocation weights across major crypto sectors and cash based on multi-factor momentum and volatility signals. Best viewed on INDEX:BTCUSD 1D chart. Other charts and timeframes may give mixed signals and incoherent allocations.
🎯 How It Works
This model systematically evaluates the relative strength of:
BTC Dominance (CRYPTOCAP:BTC.D)
Represents Bitcoin’s share of the total crypto market. Rising dominance typically indicates defensive market phases or BTC-led trends.
ETH/BTC Ratio (BINANCE:ETHBTC)
Gauges Ethereum’s relative performance versus Bitcoin. This provides insight into whether ETH is leading risk appetite.
SOL/BTC Ratio (BINANCE:SOLBTC)
Measures Solana’s performance relative to Bitcoin, capturing mid-cap layer-1 strength.
Total Market Cap excluding BTC and ETH (CRYPTOCAP:TOTAL3ES)
Represents Altcoins as a broad category, reflecting appetite for higher-risk assets.
Each of these series is:
✅ Converted to a momentum slope over a configurable lookback period.
✅ Standardized into Z-scores to normalize changes relative to recent behavior.
✅ Smoothed optionally using a Hull Moving Average for cleaner signals.
✅ Divided by ATR-based volatility to create a risk-weighted score.
✅ Scaled to proportionally allocate exposure, applying user-configured minimum and maximum constraints.
🪙 Dynamic Allocation Logic
All signals are normalized to sum to 100% if fully confident.
An overall confidence factor (based on total signal strength) scales the allocation up or down.
Any residual is allocated to cash (unallocated capital) for conservative exposure.
The script automatically avoids “all-in” bias and prevents negative allocations.
📊 Outputs
The indicator displays:
Market Phase Detection (which asset class is currently leading)
Risk Mode (Risk On, Neutral, Risk Off)
Dynamic Allocations for BTC, ETH, SOL, Alts, and Cash
Optional momentum plots for transparency
🧠 Why This Is Unique
Unlike simple dominance indicators or crossovers, this model:
Integrates multiple cross-asset signals (BTC, ETH, SOL, Alts)
Adjusts exposure proportionally to signal strength
Normalizes by volatility, dynamically scaling risk
Includes configurable constraints to reflect your own risk tolerance
Provides a cash fallback allocation when conviction is low
Is entirely non-repainting and based on daily closing data
⚠️ Disclaimer
This script is provided for educational and informational purposes only.
It is not financial advice and should not be relied upon to make investment decisions.
Past performance does not guarantee future results.
Always consult a qualified financial advisor before acting on any information derived from this tool.
🛠 Recommended Use
As a framework to visualize relative momentum and risk-adjusted allocations
For research and backtesting ideas on portfolio allocation across crypto sectors
To help build your own risk management process
This script is not a turnkey strategy and should be customized to fit your goals.
✅ Enjoy exploring dynamic crypto allocations responsibly!

Bear Market Probability Model# Bear Market Probability Model: A Multi-Factor Risk Assessment Framework
The Bear Market Probability Model represents a comprehensive quantitative framework for assessing systemic market risk through the integration of 13 distinct risk factors across four analytical categories: macroeconomic indicators, technical analysis factors, market sentiment measures, and market breadth metrics. This indicator synthesizes established financial research methodologies to provide real-time probabilistic assessments of impending bear market conditions, offering institutional-grade risk management capabilities to retail and professional traders alike.
## Theoretical Foundation
### Historical Context of Bear Market Prediction
Bear market prediction has been a central focus of financial research since the seminal work of Dow (1901) and the subsequent development of technical analysis theory. The challenge of predicting market downturns gained renewed academic attention following the market crashes of 1929, 1987, 2000, and 2008, leading to the development of sophisticated multi-factor models.
Fama and French (1989) demonstrated that certain financial variables possess predictive power for stock returns, particularly during market stress periods. Their three-factor model laid the groundwork for multi-dimensional risk assessment, which this indicator extends through the incorporation of real-time market microstructure data.
### Methodological Framework
The model employs a weighted composite scoring methodology based on the theoretical framework established by Campbell and Shiller (1998) for market valuation assessment, extended through the incorporation of high-frequency sentiment and technical indicators as proposed by Baker and Wurgler (2006) in their seminal work on investor sentiment.
The mathematical foundation follows the general form:
Bear Market Probability = Σ(Wi × Ci) / ΣWi × 100
Where:
- Wi = Category weight (i = 1,2,3,4)
- Ci = Normalized category score
- Categories: Macroeconomic, Technical, Sentiment, Breadth
## Component Analysis
### 1. Macroeconomic Risk Factors
#### Yield Curve Analysis
The inclusion of yield curve inversion as a primary predictor follows extensive research by Estrella and Mishkin (1998), who demonstrated that the term spread between 3-month and 10-year Treasury securities has historically preceded all major recessions since 1969. The model incorporates both the 2Y-10Y and 3M-10Y spreads to capture different aspects of monetary policy expectations.
Implementation:
- 2Y-10Y Spread: Captures market expectations of monetary policy trajectory
- 3M-10Y Spread: Traditional recession predictor with 12-18 month lead time
Scientific Basis: Harvey (1988) and subsequent research by Ang, Piazzesi, and Wei (2006) established the theoretical foundation linking yield curve inversions to economic contractions through the expectations hypothesis of the term structure.
#### Credit Risk Premium Assessment
High-yield credit spreads serve as a real-time gauge of systemic risk, following the methodology established by Gilchrist and Zakrajšek (2012) in their excess bond premium research. The model incorporates the ICE BofA High Yield Master II Option-Adjusted Spread as a proxy for credit market stress.
Threshold Calibration:
- Normal conditions: < 350 basis points
- Elevated risk: 350-500 basis points
- Severe stress: > 500 basis points
#### Currency and Commodity Stress Indicators
The US Dollar Index (DXY) momentum serves as a risk-off indicator, while the Gold-to-Oil ratio captures commodity market stress dynamics. This approach follows the methodology of Akram (2009) and Beckmann, Berger, and Czudaj (2015) in analyzing commodity-currency relationships during market stress.
### 2. Technical Analysis Factors
#### Multi-Timeframe Moving Average Analysis
The technical component incorporates the well-established moving average convergence methodology, drawing from the work of Brock, Lakonishok, and LeBaron (1992), who provided empirical evidence for the profitability of technical trading rules.
Implementation:
- Price relative to 50-day and 200-day simple moving averages
- Moving average convergence/divergence analysis
- Multi-timeframe MACD assessment (daily and weekly)
#### Momentum and Volatility Analysis
The model integrates Relative Strength Index (RSI) analysis following Wilder's (1978) original methodology, combined with maximum drawdown analysis based on the work of Magdon-Ismail and Atiya (2004) on optimal drawdown measurement.
### 3. Market Sentiment Factors
#### Volatility Index Analysis
The VIX component follows the established research of Whaley (2009) and subsequent work by Bekaert and Hoerova (2014) on VIX as a predictor of market stress. The model incorporates both absolute VIX levels and relative VIX spikes compared to the 20-day moving average.
Calibration:
- Low volatility: VIX < 20
- Elevated concern: VIX 20-25
- High fear: VIX > 25
- Panic conditions: VIX > 30
#### Put-Call Ratio Analysis
Options flow analysis through put-call ratios provides insight into sophisticated investor positioning, following the methodology established by Pan and Poteshman (2006) in their analysis of informed trading in options markets.
### 4. Market Breadth Factors
#### Advance-Decline Analysis
Market breadth assessment follows the classic work of Fosback (1976) and subsequent research by Brown and Cliff (2004) on market breadth as a predictor of future returns.
Components:
- Daily advance-decline ratio
- Advance-decline line momentum
- McClellan Oscillator (Ema19 - Ema39 of A-D difference)
#### New Highs-New Lows Analysis
The new highs-new lows ratio serves as a market leadership indicator, based on the research of Zweig (1986) and validated in academic literature by Zarowin (1990).
## Dynamic Threshold Methodology
The model incorporates adaptive thresholds based on rolling volatility and trend analysis, following the methodology established by Pagan and Sossounov (2003) for business cycle dating. This approach allows the model to adjust sensitivity based on prevailing market conditions.
Dynamic Threshold Calculation:
- Warning Level: Base threshold ± (Volatility × 1.0)
- Danger Level: Base threshold ± (Volatility × 1.5)
- Bounds: ±10-20 points from base threshold
## Professional Implementation
### Institutional Usage Patterns
Professional risk managers typically employ multi-factor bear market models in several contexts:
#### 1. Portfolio Risk Management
- Tactical Asset Allocation: Reducing equity exposure when probability exceeds 60-70%
- Hedging Strategies: Implementing protective puts or VIX calls when warning thresholds are breached
- Sector Rotation: Shifting from growth to defensive sectors during elevated risk periods
#### 2. Risk Budgeting
- Value-at-Risk Adjustment: Incorporating bear market probability into VaR calculations
- Stress Testing: Using probability levels to calibrate stress test scenarios
- Capital Requirements: Adjusting regulatory capital based on systemic risk assessment
#### 3. Client Communication
- Risk Reporting: Quantifying market risk for client presentations
- Investment Committee Decisions: Providing objective risk metrics for strategic decisions
- Performance Attribution: Explaining defensive positioning during market stress
### Implementation Framework
Professional traders typically implement such models through:
#### Signal Hierarchy:
1. Probability < 30%: Normal risk positioning
2. Probability 30-50%: Increased hedging, reduced leverage
3. Probability 50-70%: Defensive positioning, cash building
4. Probability > 70%: Maximum defensive posture, short exposure consideration
#### Risk Management Integration:
- Position Sizing: Inverse relationship between probability and position size
- Stop-Loss Adjustment: Tighter stops during elevated risk periods
- Correlation Monitoring: Increased attention to cross-asset correlations
## Strengths and Advantages
### 1. Comprehensive Coverage
The model's primary strength lies in its multi-dimensional approach, avoiding the single-factor bias that has historically plagued market timing models. By incorporating macroeconomic, technical, sentiment, and breadth factors, the model provides robust risk assessment across different market regimes.
### 2. Dynamic Adaptability
The adaptive threshold mechanism allows the model to adjust sensitivity based on prevailing volatility conditions, reducing false signals during low-volatility periods and maintaining sensitivity during high-volatility regimes.
### 3. Real-Time Processing
Unlike traditional academic models that rely on monthly or quarterly data, this indicator processes daily market data, providing timely risk assessment for active portfolio management.
### 4. Transparency and Interpretability
The component-based structure allows users to understand which factors are driving risk assessment, enabling informed decision-making about model signals.
### 5. Historical Validation
Each component has been validated in academic literature, providing theoretical foundation for the model's predictive power.
## Limitations and Weaknesses
### 1. Data Dependencies
The model's effectiveness depends heavily on the availability and quality of real-time economic data. Federal Reserve Economic Data (FRED) updates may have lags that could impact model responsiveness during rapidly evolving market conditions.
### 2. Regime Change Sensitivity
Like most quantitative models, the indicator may struggle during unprecedented market conditions or structural regime changes where historical relationships break down (Taleb, 2007).
### 3. False Signal Risk
Multi-factor models inherently face the challenge of balancing sensitivity with specificity. The model may generate false positive signals during normal market volatility periods.
### 4. Currency and Geographic Bias
The model focuses primarily on US market indicators, potentially limiting its effectiveness for global portfolio management or non-USD denominated assets.
### 5. Correlation Breakdown
During extreme market stress, correlations between risk factors may increase dramatically, reducing the model's diversification benefits (Forbes and Rigobon, 2002).
## References
Akram, Q. F. (2009). Commodity prices, interest rates and the dollar. Energy Economics, 31(6), 838-851.
Ang, A., Piazzesi, M., & Wei, M. (2006). What does the yield curve tell us about GDP growth? Journal of Econometrics, 131(1-2), 359-403.
Baker, M., & Wurgler, J. (2006). Investor sentiment and the cross‐section of stock returns. The Journal of Finance, 61(4), 1645-1680.
Baker, S. R., Bloom, N., & Davis, S. J. (2016). Measuring economic policy uncertainty. The Quarterly Journal of Economics, 131(4), 1593-1636.
Barber, B. M., & Odean, T. (2001). Boys will be boys: Gender, overconfidence, and common stock investment. The Quarterly Journal of Economics, 116(1), 261-292.
Beckmann, J., Berger, T., & Czudaj, R. (2015). Does gold act as a hedge or a safe haven for stocks? A smooth transition approach. Economic Modelling, 48, 16-24.
Bekaert, G., & Hoerova, M. (2014). The VIX, the variance premium and stock market volatility. Journal of Econometrics, 183(2), 181-192.
Brock, W., Lakonishok, J., & LeBaron, B. (1992). Simple technical trading rules and the stochastic properties of stock returns. The Journal of Finance, 47(5), 1731-1764.
Brown, G. W., & Cliff, M. T. (2004). Investor sentiment and the near-term stock market. Journal of Empirical Finance, 11(1), 1-27.
Campbell, J. Y., & Shiller, R. J. (1998). Valuation ratios and the long-run stock market outlook. The Journal of Portfolio Management, 24(2), 11-26.
Dow, C. H. (1901). Scientific stock speculation. The Magazine of Wall Street.
Estrella, A., & Mishkin, F. S. (1998). Predicting US recessions: Financial variables as leading indicators. Review of Economics and Statistics, 80(1), 45-61.
Fama, E. F., & French, K. R. (1989). Business conditions and expected returns on stocks and bonds. Journal of Financial Economics, 25(1), 23-49.
Forbes, K. J., & Rigobon, R. (2002). No contagion, only interdependence: measuring stock market comovements. The Journal of Finance, 57(5), 2223-2261.
Fosback, N. G. (1976). Stock market logic: A sophisticated approach to profits on Wall Street. The Institute for Econometric Research.
Gilchrist, S., & Zakrajšek, E. (2012). Credit spreads and business cycle fluctuations. American Economic Review, 102(4), 1692-1720.
Harvey, C. R. (1988). The real term structure and consumption growth. Journal of Financial Economics, 22(2), 305-333.
Kahneman, D., & Tversky, A. (1979). Prospect theory: An analysis of decision under risk. Econometrica, 47(2), 263-291.
Magdon-Ismail, M., & Atiya, A. F. (2004). Maximum drawdown. Risk, 17(10), 99-102.
Nickerson, R. S. (1998). Confirmation bias: A ubiquitous phenomenon in many guises. Review of General Psychology, 2(2), 175-220.
Pagan, A. R., & Sossounov, K. A. (2003). A simple framework for analysing bull and bear markets. Journal of Applied Econometrics, 18(1), 23-46.
Pan, J., & Poteshman, A. M. (2006). The information in option volume for future stock prices. The Review of Financial Studies, 19(3), 871-908.
Taleb, N. N. (2007). The black swan: The impact of the highly improbable. Random House.
Whaley, R. E. (2009). Understanding the VIX. The Journal of Portfolio Management, 35(3), 98-105.
Wilder, J. W. (1978). New concepts in technical trading systems. Trend Research.
Zarowin, P. (1990). Size, seasonality, and stock market overreaction. Journal of Financial and Quantitative Analysis, 25(1), 113-125.
Zweig, M. E. (1986). Winning on Wall Street. Warner Books.

Uptrick: Asset Rotation SystemOverview
The Uptrick: Asset Rotation System is a high-level performance-based crypto rotation tool. It evaluates the normalized strength of selected assets and dynamically simulates capital rotation into the strongest asset while optionally sidestepping into cash when performance drops. Built to deliver an intelligent, low-noise view of where capital should move, this system is ideal for traders focused on strength-driven allocation without relying on standard technical indicators.
Purpose
The purpose of this tool is to identify outperforming assets based strictly on relative price behavior and automatically simulate how a portfolio would evolve if it consistently moved into the strongest performer. By doing so, it gives users a realistic and dynamic model for capital optimization, making it especially suitable during trending markets and major crypto cycles. Additionally, it includes an optional safety fallback mechanism into cash to preserve capital during risk-off conditions.
Originality
This system stands out due to its strict use of normalized performance as the only basis for decision-making. No RSI, no MACD, no trend oscillators. It does not rely on any traditional indicator logic. The rotation logic depends purely on how each asset is performing over a user-defined lookback period. There is a single optional moving average filter, but this is used internally for refinement, not for entry or exit logic. The system’s intelligence lies in its minimalism and precision — using normalized asset scores to continuously rotate capital with clarity and consistency.
Inputs
General
Normalization Length: Defines how many bars are used to calculate each asset’s normalized score. This score is used to compare asset performance.
Visuals: Selects between Equity Curve (show strategy growth over time) or Asset Performance (compare asset strength visually).
Detect after bar close: Ensures changes only happen after a candle closes (for safety), or allows bar-by-bar updates for quicker reactions.
Moving Average
Used internally for optional signal filtering.
MA Type: Lets you choose which moving average type to use (EMA, SMA, WMA, RMA, SMMA, TEMA, DEMA, LSMA, EWMA, SWMA).
MA Length: Sets how many bars the moving average should calculate over.
Use MA Filter: Turns the filter on or off. It doesn’t affect the signal directly — just adds a layer of control.
Backtest
Used to simulate equity tracking from a chosen starting point. All calculations begin from the selected start date. Prior data is ignored for equity tracking, allowing users to isolate specific market cycles or testing periods.
Starting Day / Month / Year: The exact day the strategy starts tracking equity.
Initial Capital $: The amount of simulated starting capital used for performance calculation.
Rotation Assets
Each asset has 3 controls:
Enable: Include or exclude this asset from the rotation engine.
Symbol: The ticker for the asset (e.g., BINANCE:BTCUSDT).
Color: The color for visualization (labels, plots, tables).
Assets supported by default:
BTC, ETH, SOL, XRP, BNB, NEAR, PEPE, ADA, BRETT, SUI
Cash Rotation
Normalization Threshold USDC: If all assets fall below this threshold, the system rotates into cash.
Symbol & Color: Sets the cash color for plots and tables.
Customization
Dynamic Label Colors: Makes labels change color to match the current asset.
Enable Asset Label: Plots asset name labels on the chart.
Asset Table Position: Choose where the key asset usage table appears.
Performance Table Position: Choose where the backtest performance table appears.
Enable Realism: Enables slippage and fee simulation for realistic equity tracking. Adjusted profit is shown in the performance table.
Equity Styling
Show Equity Curve (STYLING): Toggles an extra-thick visual equity curve.
Background Color: Adds a soft background color that matches the current asset.
Features
Dual Visualization Modes
The script offers two powerful modes for real-time visual insights:
Equity Curve Mode: Simulates the growth of a portfolio over time using dynamic asset rotation. It visually tracks capital as it moves between outperforming assets, showing compounded returns and the current allocation through both line plots and background color.
Asset Performance Mode: Displays the normalized performance of all selected assets over the chosen lookback period. This mode is ideal for comparing relative strength and seeing how different coins perform in real-time against one another, regardless of price level.
Multi-Asset Rotation Logic
You can choose up to 10 unique assets, each fully customizable by symbol and color. This allows full flexibility for different strategies — whether you're rotating across majors like BTC, ETH, and SOL, or including meme tokens and stablecoins. You decide the rotation universe. If none of the selected assets meet the strength threshold, the system automatically moves to cash as a protective fallback.
Key Asset Selection Table
This on-screen table displays how frequently each enabled asset was selected as the top performer. It updates in real time and can help traders understand which assets the system has historically favored.
Asset Name: Shortened for readability
Color Box: Visual color representing the asset
% Used: How often the asset was selected (as a percentage of strategy runtime)
This table gives clear insight into historical rotation behavior and asset dominance over time.
Performance Comparison Table
This second table shows a full backtest vs. chart comparison, broken down into key performance metrics:
Backtest Start Date
Chart Asset Return (%) – The performance of the asset you’re currently viewing
System Return (%) – The equity growth of the rotation strategy
Outperformed By – Shows how many times the system beat the chart (e.g., 2.1x)
Slippage – Estimated total slippage costs over the strategy
Fees – Estimated trading fees based on rotation activity
Total Switches – Number of times the system changed assets
Adjusted Profit (%) – Final net return after subtracting fees and slippage
Equity Curve Styling
To enhance visual clarity and aesthetics, the equity curve includes styling options:
Custom Thickness Curve: A second stylized line plots a shadow or highlight of the main equity curve for stronger visual feedback
Dynamic Background Coloring: The chart background changes color to match the currently held asset, giving instant visual context
Realism Mode
By enabling Realism, the system calculates estimated:
Trading Fees (default 0.1%)
Slippage (default 0.05%)
These costs are subtracted from the equity curve in real time, and shown in the table to produce an Adjusted Return metric — giving users a more honest and execution-aware picture of system performance.
Adaptive Labeling System
Each time the asset changes, an on-chart label updates to show:
Current Asset
Live Equity Value
These labels dynamically adjust in color and visibility depending on the asset being held and your styling preferences.
Full Customization
From visual position settings to table placements and custom asset color coding, the entire system is fully modular. You can move tables around the screen, toggle background visuals, and control whether labels are colored dynamically or uniformly.
Key Concepts
Normalized values represent how much an asset has changed relative to its past price over a fixed period, allowing performance comparisons across different assets. Outperforming refers to the asset with the highest normalized value at a given time. Cash fallback means the system moves into a stable asset like USDC when no strong performers are available. The equity curve is a running total of simulated capital over time. Slippage is the small price difference between expected and actual trade execution due to market movement.
Use Case Flexibility
You don’t need to use all 10 assets. The system works just as effectively with only 1 asset — such as rotating between CASH and SOL — for a simple, minimal strategy. This is ideal for more focused portfolios or thematic rotation systems.
How to Use the Indicator
To use the Uptrick: Asset Rotation System, start by selecting which assets to include and entering their symbols (e.g., BINANCE:BTCUSDT). Choose between Equity Curve mode to see simulated portfolio growth, or Asset Performance mode to compare asset strength. Set your lookback period, backtest start date, and optionally enable the moving average filter or realism settings for slippage and fees. The system will then automatically rotate into the strongest asset, or into cash if no asset meets the strength threshold. Use alerts to be notified when a rotation occurs.
Asset Switch Alerts
The script includes built-in alert conditions for when the system rotates into a new asset. You can enable these to be notified when the system reallocates to a different coin or to cash. Each alert message is labeled by target asset and can be used for automation or monitoring purposes.
Conclusion
The Uptrick: Asset Rotation System is a next-generation rotation engine designed to cut through noise and overcomplication. It gives users direct insight into capital strength, without relying on generic indicators. Whether used to track a broad basket or focus on just two assets, it is built for accuracy, adaptability, and transparency — all in real-time.
Disclaimer
This script is for research and educational purposes only. It is not intended as financial advice. Past performance is not a guarantee of future results. Always consult with a financial professional and evaluate risks before trading or investing.

GCM Supreme Trading System Pro (With Golden Zone)Okay, bro! Here are some notes on your "GCM Supreme Trading System Pro (Dashboard + RSI)" indicator based on the Pine Script code you provided. Think of this as a breakdown of its components, logic, and how you might use it, along with some things to consider.
GCM Supreme Trading System Pro (Dashboard + RSI) - Notes
Overall Concept:
This indicator aims to provide an "all-in-one" visual dashboard and signal system by combining several technical analysis concepts:
Short-Term Trend: Using a fast EMA.
Volatility/Channel: High/Low plot with fill.
Sentiment: Background color based on price vs. EMA.
Price Structure/Pattern: Highlighting potential AMD phases.
Key Price Level: Previous day's specific Fibonacci zone (Golden Zone).
Momentum: RSI Overbought/Oversold status.
Volume Analysis: Identifying volume spikes.
Risk Assessment: Based on ATR volatility.
Signal Generation: Based on EMA direction change confirmed by candle color.
Centralized Summary: A dashboard showing the status of key components.
Key Components & How They Work:
Trend EMA (Length: 3 by default):
What: A very fast Exponential Moving Average of the specified source (close by default).
How: Plots the EMA line. Colors the line green if the EMA is moving up, red if moving down, gray if flat.
Usage: Provides a very quick view of the immediate price direction and momentum.
High/Low Channel Lines & Fill:
What: Plots the current bar's high and low.
How: The area between the high and low is filled. The fill color changes based on whether the Trend EMA is moving up (green fill), down (red fill), or is neutral (gray fill).
Usage: Visualizes the recent price range/volatility and ties it to the immediate trend direction.
Sentiment Background:
What: Colors the chart background.
How: Background is lightly colored green if the close is above the Trend EMA, and red if the close is below the Trend EMA.
Usage: Reinforces the current short-term bias based on price's position relative to the fast EMA.
AMD Pattern Candles:
What: Highlights specific candle patterns often associated with Accumulation, Manipulation, and Distribution phases.
How:
Accumulation (Aqua): Previous candle was Red, current candle is Green (Red -> Green).
Manipulation (Yellow): Previous candle was Green, current candle is Red (Green -> Red).
Distribution (Fuchsia): Two consecutive Red candles where the candle before the first Red was Not Red (Not Red -> Red -> Red).
Usage: Helps visually spot potential shifts in market behavior according to the AMD concept.
Previous Day's Fib Golden Zone (0.55-0.66):
What: Calculates a specific Fibonacci zone (between 55% and 66%) based on the previous day's range (High-Low).
How: Plots a horizontal box on the chart covering the calculated zone level. Uses the previous day's range direction (Green/Red candle) to determine if the zone is calculated up from the low (Green day) or down from the high (Red day).
Usage: Identifies a potential key retracement or support/resistance zone from the previous day's price action that may be relevant for the current day.
RSI (Relative Strength Index):
What: A classic momentum oscillator.
How: Calculates the RSI value based on the specified length and source. The dashboard shows the current value and flags it as Overbought (> OB level), Oversold (< OS level), or Neutral.
Usage: Provides context on momentum extremes. High RSI suggests strong upward momentum (potentially overextended), low RSI suggests strong downward momentum (potentially oversold).
Volume Spike Confirmation:
What: Compares current volume to its Moving Average.
How: Calculates a simple moving average of volume. Identifies a "Spike" if the current volume is significantly higher (multiplied by a factor) than the MA.
Usage: Provides a contextual check for increased activity accompanying price moves. (Note: In the current script, this is calculated and shown on the dashboard but not directly used in the signal label logic, though it could be added).
Risk Assessment (ATR):
What: Uses the Average True Range.
How: Calculates the ATR for the specified length. Compares the current ATR to a longer-term average ATR. Flags "High Risk" if the current ATR is significantly higher than the average.
Usage: Gives an indication of current volatility relative to recent history, which can inform stop-loss placement or position sizing.
Signals (Buy/Sell Labels):
What: Plots "BUY" or "SELL" labels on the chart.
How:
BUY Signal: Triggers when the Trend EMA starts moving Up on the previous bar AND the current bar is Green (close > open).
SELL Signal: Triggers when the Trend EMA starts moving Down on the previous bar AND the current bar is Red (close < open).
Usage: These are your potential entry triggers. They indicate that the fast EMA trend has just changed direction and the current candle is confirming that move with its color.
Dashboard:
What: A 2x5 table displayed on the chart (bottom right by default).
How: Shows the current status of:
Trend (Bull/Bear/Neutral)
Volume (Spike/Normal)
Last Signal (🟢 BUY, 🔴 SELL, or None)
Risk (High/Normal based on ATR)
RSI (Overbought/Oversold/Neutral + Current Value)
Usage: Provides a quick, centralized summary of multiple indicator components without having to visually check every detail on the chart or separate panes.
How to Potentially Use It (Example Interpretation):
Look for a BUY signal (Green label) when:
The dashboard shows "🟢 BUY" as the Last Signal.
Consider additional confirmation: Is Volume status "Spike"? Is Risk "Normal"? Is RSI not "Overbought" (or perhaps just coming out of "Oversold" territory)? Is the price above/interacting positively with the Golden Zone?
Look for a SELL signal (Red label) when:
The dashboard shows "🔴 SELL" as the Last Signal.
Consider additional confirmation: Is Volume status "Spike"? Is Risk "Normal"? Is RSI not "Oversold" (or perhaps just coming out of "Overbought" territory)? Is the price below/interacting negatively with the Golden Zone?
Use the Sentiment Background and High/Low Channel Fill to quickly see the immediate trend and volatility context.
Watch AMD candles around key levels (like the Golden Zone or signal triggers) for potential pattern confirmation.
Check the Dashboard frequently for a summary of all these factors, even without a specific signal.
Strengths & Potential Benefits:
Comprehensive View: Integrates multiple popular trading concepts into a single indicator.
Visual Clarity: Uses colors, fills, labels, and a dashboard for easy interpretation.
Customizable: Inputs allow tuning the sensitivity of the EMA, Volume, ATR, and RSI to different assets/timeframes.
Dashboard Efficiency: Saves time by consolidating key status points.
Non-Repainting Signals: The buy/sell labels trigger and stay based on closed bar data.
Important Considerations & Limitations:
Fast EMA Sensitivity: An EMA length of 3 is very fast and prone to whipsaws, especially in choppy or ranging markets. Signals based solely on this could be frequent and unreliable in non-trending conditions.
Signal Logic: The core signal is only based on EMA direction change + candle color. While simple, it might miss opportunities or generate signals without broader market confirmation (like strong volume, favorable RSI position, or reaction at key levels). The dashboard provides these other factors as context, but they aren't required for the signal label in the current code.
Golden Zone Reliance: The previous day's Fib zone is just one potential level. It won't always be respected, and its relevance might vary significantly across different markets and timeframes.
AMD Patterns: The defined AMD patterns are specific. The market's "real" accumulation/manipulation/distribution might manifest in more complex ways.
Dashboard as Summary, Not Signal: Remember the dashboard shows the current status of all components on the last bar, but the BUY/SELL signal labels are based on a specific historical event (previous bar's EMA turn). You need to look at both: the label for the trigger, and the dashboard for the confluence of other factors right now.
Not a Standalone System: While called a "Trading System," no single indicator guarantees profitability. This tool provides signals and context, but requires a robust trading plan including stop losses, profit targets, position sizing, and potentially confluence with other analysis methods.
Timeframe Dependency: The ideal settings (EMA length, RSI length, etc.) will likely differ significantly between timeframes (e.g., 1-minute vs. 4-hour). Testing and optimization are crucial.
In Summary:
The "GCM Supreme Trading System Pro (Dashboard + RSI)" is a well-designed indicator that consolidates several useful analysis tools into a single view. Its strength lies in providing quick visual context and a clear signal trigger based on short-term trend shifts. However, like any indicator, it's not perfect. Its effectiveness will largely depend on the market conditions, the chosen settings, and how it's integrated into a comprehensive trading strategy, using the dashboard components as essential confirmation and risk assessment tools alongside the primary signal labels.

Uptrick: Dynamic Z-Score DeviationOverview
Uptrick: Dynamic Z‑Score Deviation is a trading indicator built in Pine Script that combines statistical filters and adaptive smoothing to highlight potential reversal points in price action. It combines a hybrid moving average, dual Z‑Score analysis on both price and RSI, and visual enhancements like slope‑based coloring, ATR‑based shadow bands, and dynamically scaled reversal signals.
Introduction
Statistical indicators like Z‑Scores measure how far a value deviates from its average relative to the typical variation (standard deviation). Standard deviation quantifies how dispersed a set of values is around its mean. A Z‑Score of +2 indicates a value two standard deviations above the mean, while -2 is two below. Traders use Z‑Scores to spot unusually high or low readings that may signal overbought or oversold conditions.
Moving averages smooth out price data to reveal trends. The Arnaud Legoux Moving Average (ALMA) reduces lag and noise through weighted averaging. A Zero‑Lag EMA (approximated here using a time‑shifted EMA) seeks to further minimize delay in following price. The RSI (Relative Strength Index) is a momentum oscillator that measures recent gains against losses over a set period.
ATR (Average True Range) gauges market volatility by averaging the range between high and low over a lookback period. Shadow bands built using ATR give a visual mood of volatility around a central trend line. Together, these tools inform a dynamic but statistically grounded view of market extremes.
Purpose
The main goal of this indicator is to help traders spot short‑term reversal opportunities on lower timeframes. By requiring both price and momentum (RSI) to exhibit statistically significant deviations from their norms, it filters out weak setups and focuses on higher‑probability mean‑reversion zones. Reversal signals appear when price deviates far enough from its hybrid moving average and RSI deviates similarly in the same direction. This makes it suitable for discretionary traders seeking clean entry cues in volatile environments.
Originality and Uniqueness
Uptrick: Dynamic Z‑Score Deviation distinguishes itself from standard reversal or mean‑reversion tools by combining several elements into a single framework:
A composite moving average (ALMA + Zero‑Lag EMA) for a smooth yet responsive baseline
Dual Z‑Score filters on price and RSI rather than relying on a single measure
Adaptive visual elements, including slope‑aware coloring, multi‑layer ATR shadows, and signal sizing based on combined Z‑Score magnitude
Most indicators focus on one aspect—price envelopes or RSI thresholds—whereas Uptrick: Dynamic Z‑Score Deviation requires both layers to align before signaling. Its visual design aids quick interpretation without overwhelming the chart.
Why these indicators were merged
Every component in Uptrick: Dynamic Z‑Score Deviation has a purpose:
• ALMA: provides a smooth moving average with reduced lag and fewer false crossovers than a simple SMA or EMA.
• Zero‑Lag EMA (ZLMA approximation): further reduces the delay relative to price by applying a time shift to EMA inputs. This keeps the composite MA closer to current price action.
• RSI and its EMA filter: RSI measures momentum. Applying an EMA filter on RSI smooths out false spikes and confirms genuine overbought or oversold momentum.
• Dual Z‑Scores: computing Z‑Scores on both the distance between price and the composite MA, and on smoothed RSI, ensures that signals only fire when both price and momentum are unusually stretched.
• ATR bands: using ATR‑based shadow layers visualizes volatility around the MA, guiding traders on potential support and resistance zones.
At the end, these pieces merge into a single indicator that detects statistically significant mean reversions while staying adaptive to real‑time volatility and momentum.
Calculations
1. Compute ALMA over the chosen MA length, offset, and sigma.
2. Approximate ZLMA by applying EMA to twice the price minus the price shifted by the MA length.
3. Calculate the composite moving average as the average of ALMA and ZLMA.
4. Compute raw RSI and smooth it with ALMA. Apply an EMA filter to raw RSI to reduce noise.
5. For both price and smoothed RSI, calculate the mean and standard deviation over the Z‑Score lookback period.
6. Compute Z‑Scores:
• z_price = (current price − composite MA mean) / standard deviation of price deviations
• z_rsi = (smoothed RSI − mean RSI) / standard deviation of RSI
7. Determine reversal conditions: both Z‑Scores exceed their thresholds in the same direction, RSI EMA is in oversold/overbought zones (below 40 or above 60), and price movement confirms directionality.
8. Compute signal strength as the sum of the absolute Z‑Scores, then classify into weak, medium, or strong.
9. Calculate ATR over the chosen period and multiply by layer multipliers to form shadow widths.
10.Derive slope over the chosen slope length and color the MA line and bars based on direction, optionally smoothing color transitions via EMA on RGB channels.
How this indicator actually works
1. The script begins by smoothing price data with ALMA and approximating a zero‑lag EMA, then averaging them for the main MA.
2. RSI is calculated, then smoothed and filtered.
3. Using a rolling window, the script computes statistical measures for both price deviations and RSI.
4. Z‑Scores tell how far current values lie from their recent norms.
5. When both Z‑Scores cross configured thresholds and momentum conditions align, reversal signals are flagged.
6. Signals are drawn with size and color reflecting strength.
7. The MA is plotted with dynamic coloring; ATR shadows are layered beneath to show volatility envelopes.
8. Bars can be colored to match MA slope, reinforcing trend context.
9. Alert conditions allow automated notifications when signals occur.
Inputs
Main Length: Main MA Length. Sets the period for ALMA and ZLMA.
RSI Length: RSI Length. Determines the lookback for momentum calculations.
Z-Score Lookback: Z‑Score Lookback. Window for mean and standard deviation computations.
Price Z-Score Threshold: Price Z‑Score Threshold. Minimum deviation required for price.
RSI Z-Score threshold: RSI Z‑Score Threshold. Minimum deviation required for momentum.
RSI EMA Filter Length: RSI EMA Filter Length. Smooths raw RSI readings.
ALMA Offset: Controls ALMA’s focal point in the window.
ALMA Sigma: Adjusts ALMA’s smoothing strength.
Show Reversal Signals : Toggle to display reversal signal markers.
Slope Sensitivity: Length for slope calculation. Higher values smooth slope changes.
Use Bar Coloring: Enables coloring of price bars based on MA slope.
Show MA Shadow: Toggle for ATR‑based shadow bands.
Shadow Layer Count: Number of shadow layers (1–4).
Base Shadow ATR Multiplier: Multiplier for ATR when sizing the first band.
Smooth Color Transitions (boolean): Smooths RGB transitions for line and shadows, if enabled.
ATR Length for Shadow: ATR Period for computing volatility bands.
Use Dynamic Signal Size: Toggles dynamic scaling of reversal symbols.
Features
Moving average smoothing: a hybrid of ALMA and Zero‑Lag EMA that balances responsiveness and noise reduction.
Slope coloring: MA line and optionally price bars change color based on trend direction; color transitions can be smoothed for visual continuity.
ATR shadow layers: translucent bands around the MA show volatility envelopes; up to four concentric layers help gauge distance from normal price swings.
Dual Z‑Score filters: price and momentum must both deviate beyond thresholds to trigger signals, reducing false positives.
Dynamic signal sizing: reversal markers scale in size based on the combined Z‑Score magnitude, making stronger signals more prominent.
Adaptive visuals: optional smoothing of color channels creates gradient effects on lines and fills for a polished look.
Alert conditions: built‑in buy and sell alerts notify traders when reversal setups emerge.
Conclusion
Uptrick: Dynamic Z‑Score Deviation delivers a structured way to identify short‑term reversal opportunities by fusing statistical rigor with adaptive smoothing and clear visual cues. It guides traders through multiple confirmation layers—hybrid moving average, dual Z‑Score analysis, momentum filtering, and volatility envelopes—while keeping the chart clean and informative.
Disclaimer
This indicator is provided for informational and educational purposes only and does not constitute financial advice. Trading carries risk and may not be suitable for all participants. Past performance is not indicative of future results. Always do your own analysis and risk management before making trading decisions.